Explore your mobile network like never before.
CNA lets both the curious amateur and the seasoned network engineer map signal coverage, track cell tower connections in real time, inspect the frequencies and bands in use, and export beautiful drive-test results straight from your Android phone.
Thank you for your interest in CNA: Cellular Network Analyser. CNA allows both the amateur and the network expert to investigate the network conditions in certain areas or along certain routes: where are the signal holes, where is coverage excellent, where are unexpected handovers between basestations that you would not expect, and which frequencies and bands is your phone actually using? CNA gives you the tools to see all of this, visualise it on a map, and share the results. And did you know there are cells that span distances of more than 40 km? You can find them with CNA.
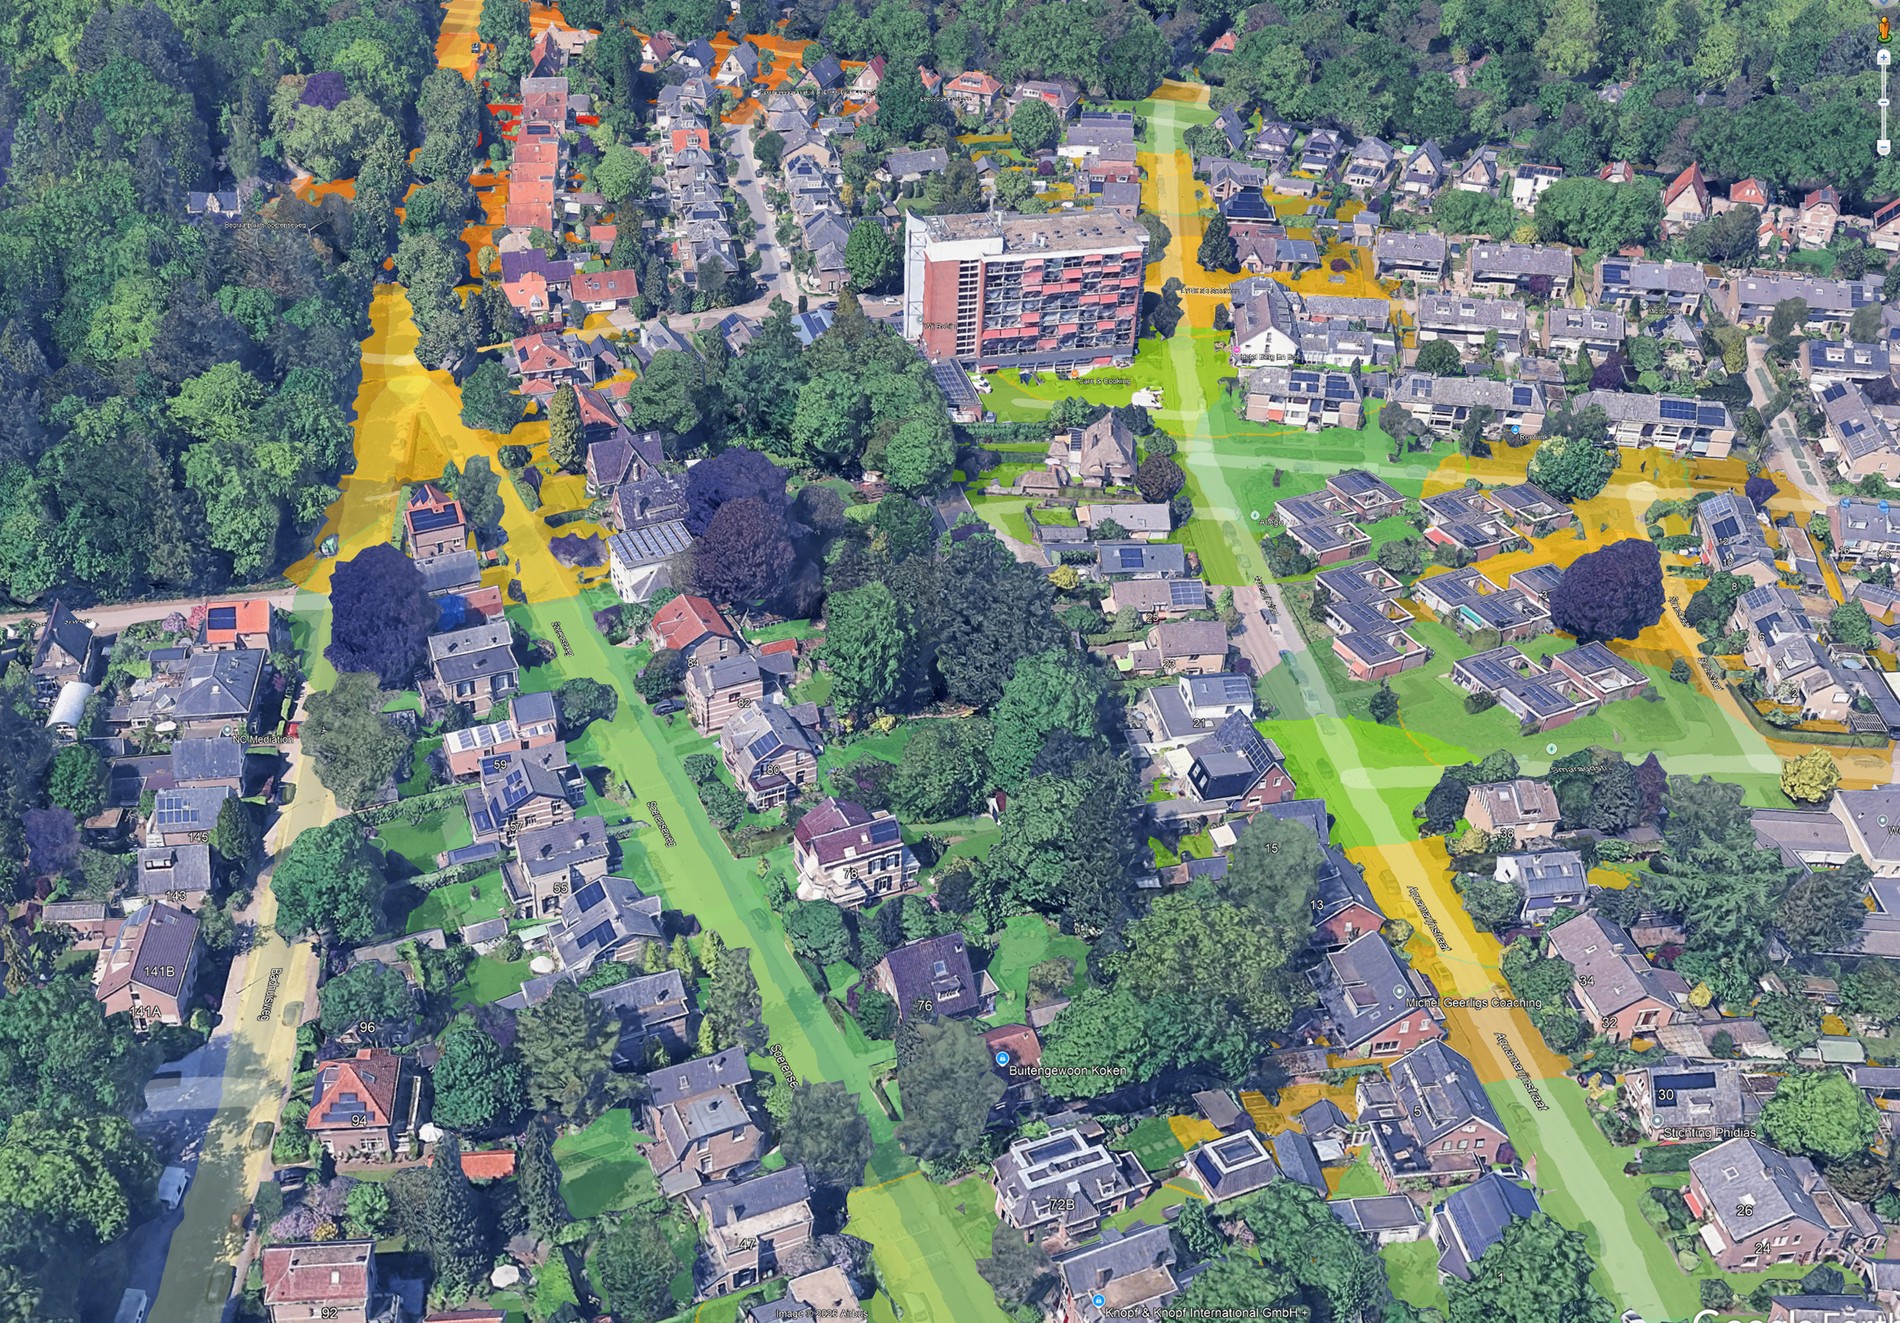
As an example of how nicely CNA allows you to capture real-life logging results, look at the screenshot below, taken from Google Earth after uploading a CNA log. It shows the results of a short drive test, and for the selected phone location — you can see from the green line that the primary cell signal is very good — you can see all the configured frequencies:
See your current cell tower on a live map in real time (street or satellite view, your choice).
Log all basestation connections along any route and replay them on an interactive map afterwards.
Tap any basestation or position marker for full technical details: cell ID, signal strength, network type and more.
See the bands and carriers your connection uses — band number, 3GPP name, (E)ARFCN, centre frequency, carrier bandwidth and signal — laid out across the downlink and uplink spectrum.
Export logs as KMZ files and open them in Google Earth for stunning network visualisations.
Export logs as CSV for analysis in Excel: compute averages, filter by network type, plot charts and more.
Supports all major mobile network technologies. Runs as a background service while you use other apps.
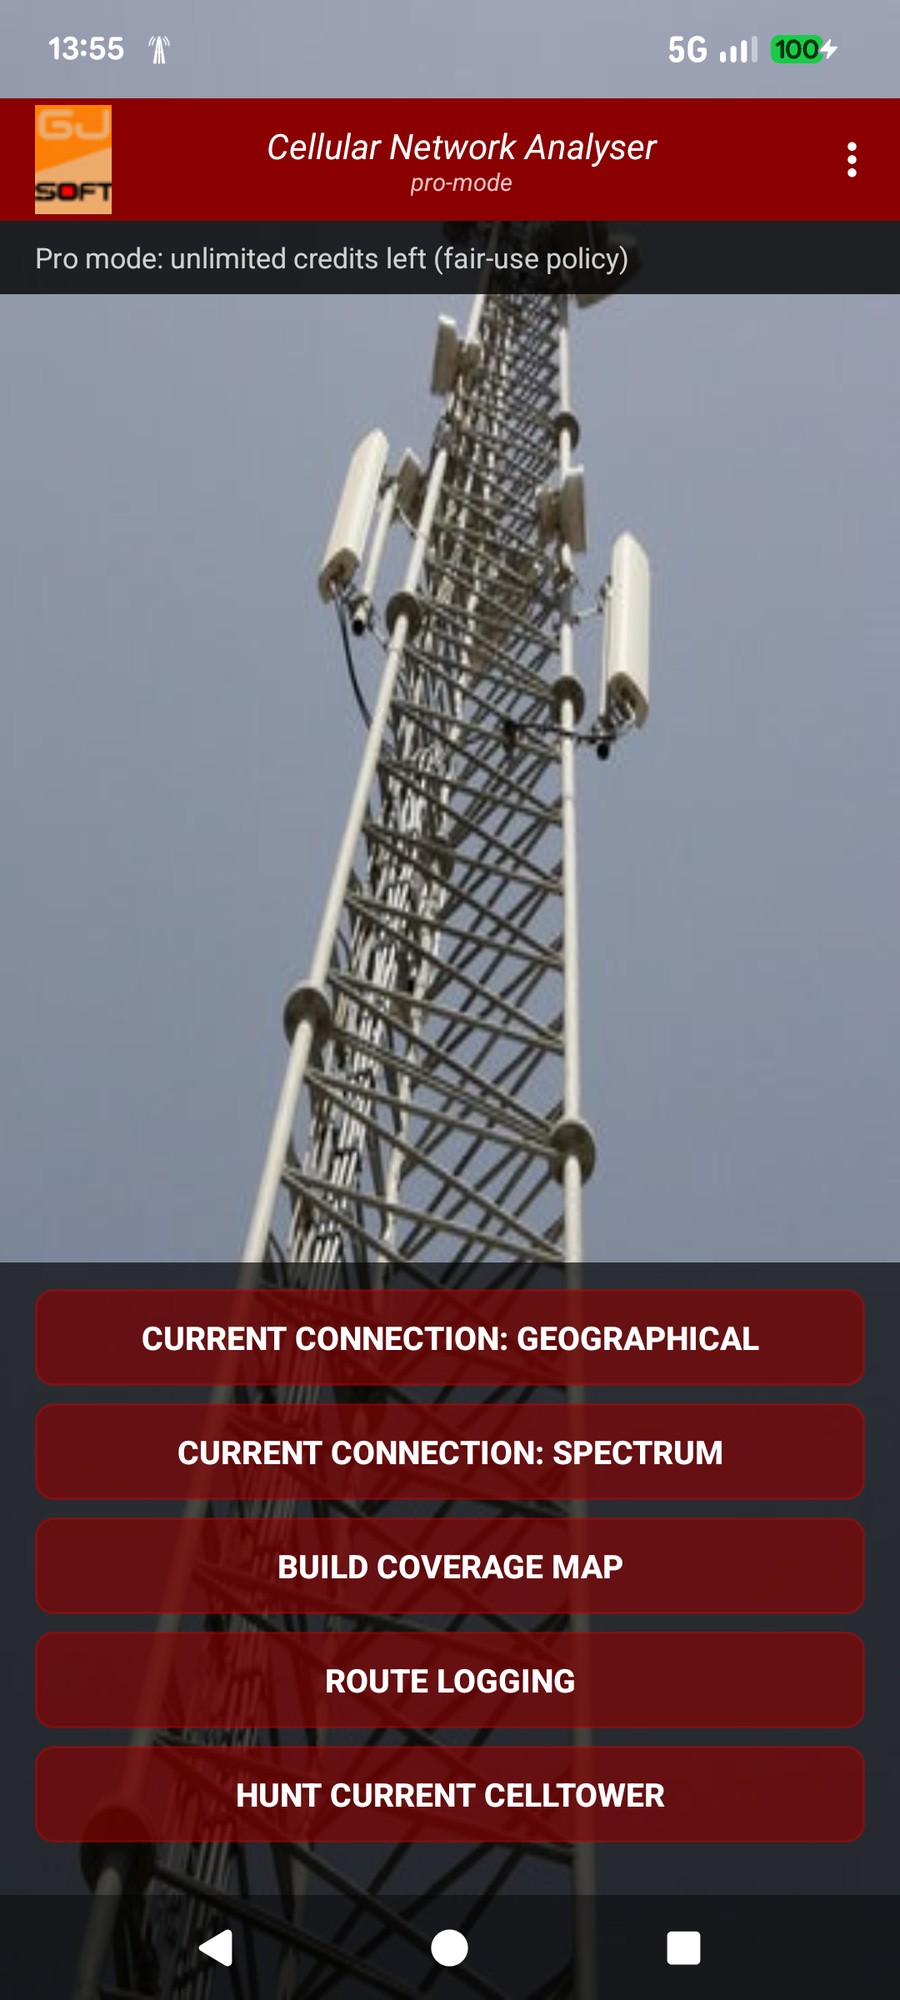
From the main screen you can inspect your current connection — in two complementary views — or record a drive-test log. Everything starts here.
The main screen is your launch pad. A strip at the top shows your current cell-tower-location credit balance, with a Buy credits button beside it. The three-dot menu (top right) opens Preferences and Info.
The buttons below do the following:
CNA shows your live connection in two complementary screens: a Geographical view and a Spectrum view. Move between them at any time by swiping left or right — swipe left on the Geographical screen to reach the Spectrum screen, and swipe right to come back. (On the map itself, hold your finger still for a moment before dragging to pan the map instead of switching screens.)
In the Geographical view you see the full details of your current cell connection at a glance: country code (MCC), operator code (MNC), network type, location/tracking area code, cell ID, signal strength, call state, data state, and data volume (bytes sent and received).
Note that GPS location needs to be turned on, even for displaying information such as country code, since Google considers this positioning information.
With an active internet connection and sufficient credits, CNA estimates the basestation location and displays it on the map, together with an estimate of the distance between you and the basestation. The line drawn between you and the tower is coloured according to the signal strength.
The Spectrum view focuses on the frequency side of your connection. Across the top, up to four cards detail each band in use, showing — where the modem provides it — the band number and technology (2G / 3G / 4G / 5G, each in its own colour), the 3GPP band name, the band bandwidth, the carrier (E)ARFCN, the downlink centre frequency, the carrier bandwidth, and the signal strength.
Below the cards, two full-width panels place those carriers in the radio spectrum — one for the downlink and one for the uplink — with one block per band, ordered by increasing frequency, and the actually-used carrier highlighted inside each band. TDD bands appear in the downlink panel and are tagged as such; uplink carriers of non-primary bands are marked with a “?” because their use cannot be confirmed.
In Logging Mode, CNA records your basestation connections and mobile position at regular intervals over a configurable duration. Start a log, put your phone in your pocket, drive or walk your route, and review the results when you are done, or even inspect the log while it is still running.
Logging starts when you press the Start Logging button. CNA will follow the periodicity and duration you have configured in User Preferences. The moment logging starts, a notification appears in Android (swipe down from the top of your screen) showing that CNA logging is ongoing. Expanding the notification also reveals a Stop Logging button.
Even if you close the CNA app, logging continues as long as you have not pressed Stop Logging in the notification.
While logging is running, press Show Ongoing Log to see the results collected so far. CNA will attempt to resolve the cell tower locations (depending on credits available) and display all mobile and cell tower positions on the map. You can tap any mobile (phone position) marker to see a detailed network snapshot — which now also includes the band, (E)ARFCN, downlink frequency and carrier bandwidth of the primary and any secondary (carrier-aggregation) cells. Tapping a cell tower marker instead shows a smaller set of details about that tower.
When logging ends, either because the configured timer expired or because you pressed Stop Logging, the log is saved to a list (up to 10 logs stored). Access the list by pressing Show / Manage Previous Logs on the main screen.
Select any stored log to open a menu with the following options:
This example also shows nicely how CNA visualises the development of the signal strength while you move: the line drawn between each mobile position and its cell tower is coloured according to the measured signal level — from red (very weak) through orange and yellow to green (strong). Following the chain of coloured links along the route, you can see at a glance where reception was excellent and where it dropped off, without having to open a single detail popup.
CNA is completely free, including all logging and exporting of cellular network parameters — there is no charge for any of that. The only thing that carries a small cost is looking up cell tower locations, because the developer has to pay for those lookups on the server side. So if you choose to use the tower-location feature, each lookup consumes one credit.
This is also why CNA asks you to sign in with your Google account at startup: so that CNA can allocate your free monthly credits.
Every month, CNA gives you 10 free credits. For casual users this may be enough. If you need more, for example for a long drive test, additional credits can be purchased via Google Play using the Buy Credits button.
Open the Preferences menu from the main screen to configure CNA to your needs.
Questions, bug reports, or suggestions for improvement? We would love to hear from you.
If you enjoy CNA, a 5-star rating in the Google Play Store is very much appreciated!
gjsoftinfo@gmail.comDisclaimer: CNA is a spare-time project. Results are provided on a best-effort basis. The developer cannot be held responsible for inaccuracies in basestation location estimates or for any decisions made based on them.