Real-time diagnostics for your Hyundai IONIQ 5
Connect your Android phone to your IONIQ 5 via a Bluetooth OBD2 adapter and get live access to battery health, cell voltages, temperatures, charging status, tyre pressures, driving efficiency and big live gauges, all directly from the car's own computer. Every reading has a plain-language explanation, so you always know what the numbers and dials mean.
The app communicates with your IONIQ 5 through the standard OBD2 diagnostic port, located under the dashboard on the driver's side. To use it you need a small Bluetooth OBD2 dongle that plugs into this port.
Plug an ELM327-compatible Bluetooth OBD2 adapter into the OBD2 port of your IONIQ 5. We recommend the Viecar adapter, but most standard ELM327 Bluetooth dongles work fine. Avoid cheap Wi-Fi only dongles, Bluetooth is required.
With the dongle plugged in and the car switched on (or in accessory mode), pair the adapter in your Android Bluetooth settings. It usually appears as "ELM327" or "VIECAR" in the device list.
Open the app, tap Start Scan and select your OBD2 adapter from the list of discovered Bluetooth devices. The app connects automatically and the dashboard appears within seconds.
Recommended dongle: the Viecar ELM327 v2.2 Bluetooth adapter is a reliable choice that works well with this app. Most other ELM327-compatible Bluetooth OBD2 adapters should work equally well. The OBD2 port in the IONIQ 5 is located beneath the steering column, easily accessible from the driver's seat.
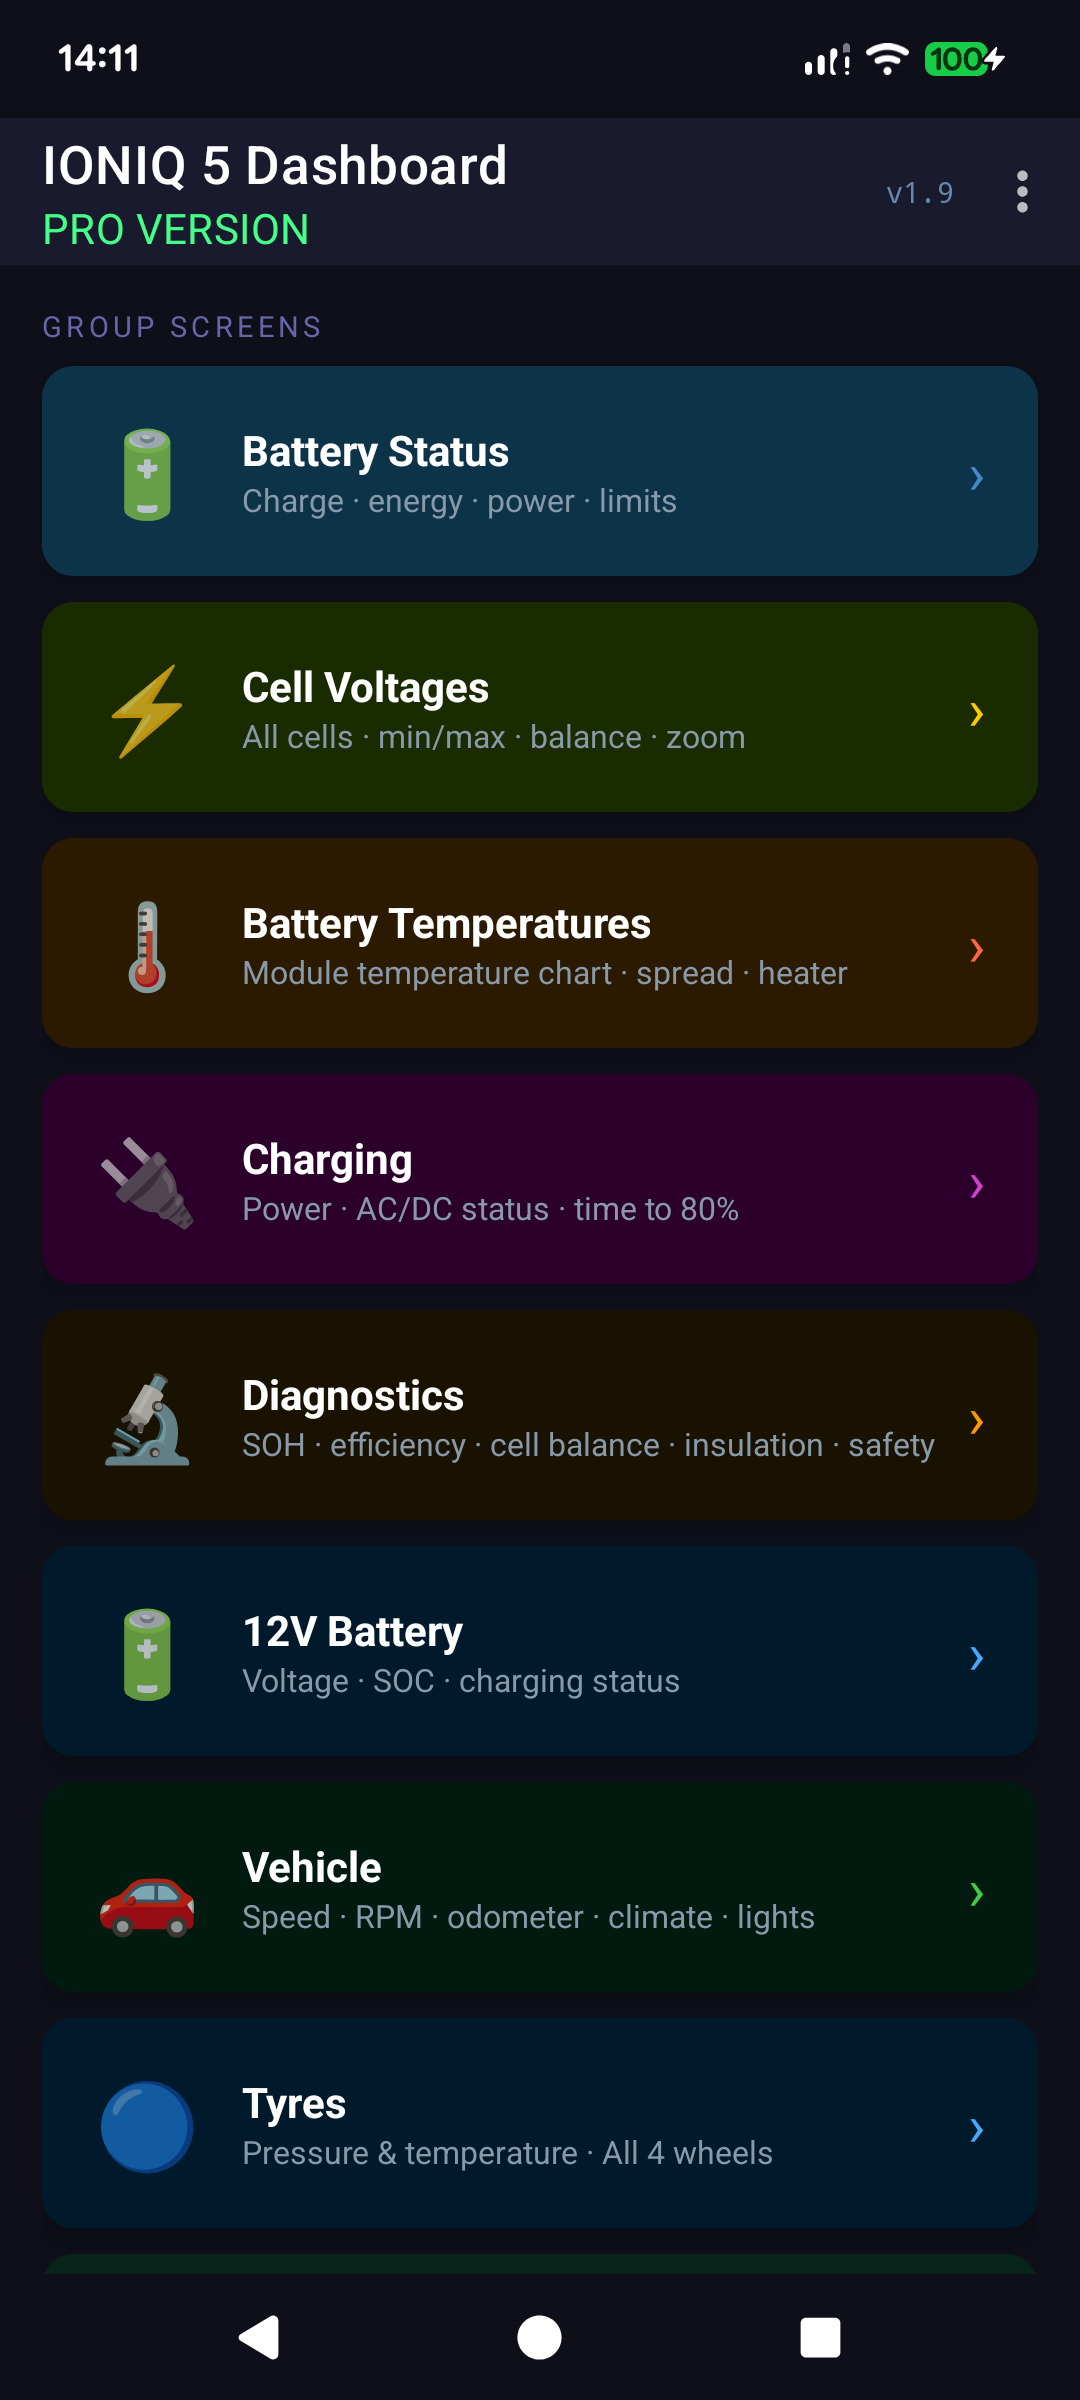
After connecting, the dashboard is your home base. Each card opens a themed screen grouped around one part of the car, with a short summary of what it contains so you can jump straight to what you need.
Throughout the app, almost every value is tappable: tap a reading and a pop-up explains in plain language what it means and what a healthy range looks like, so you are never left guessing what a number or dial is telling you.
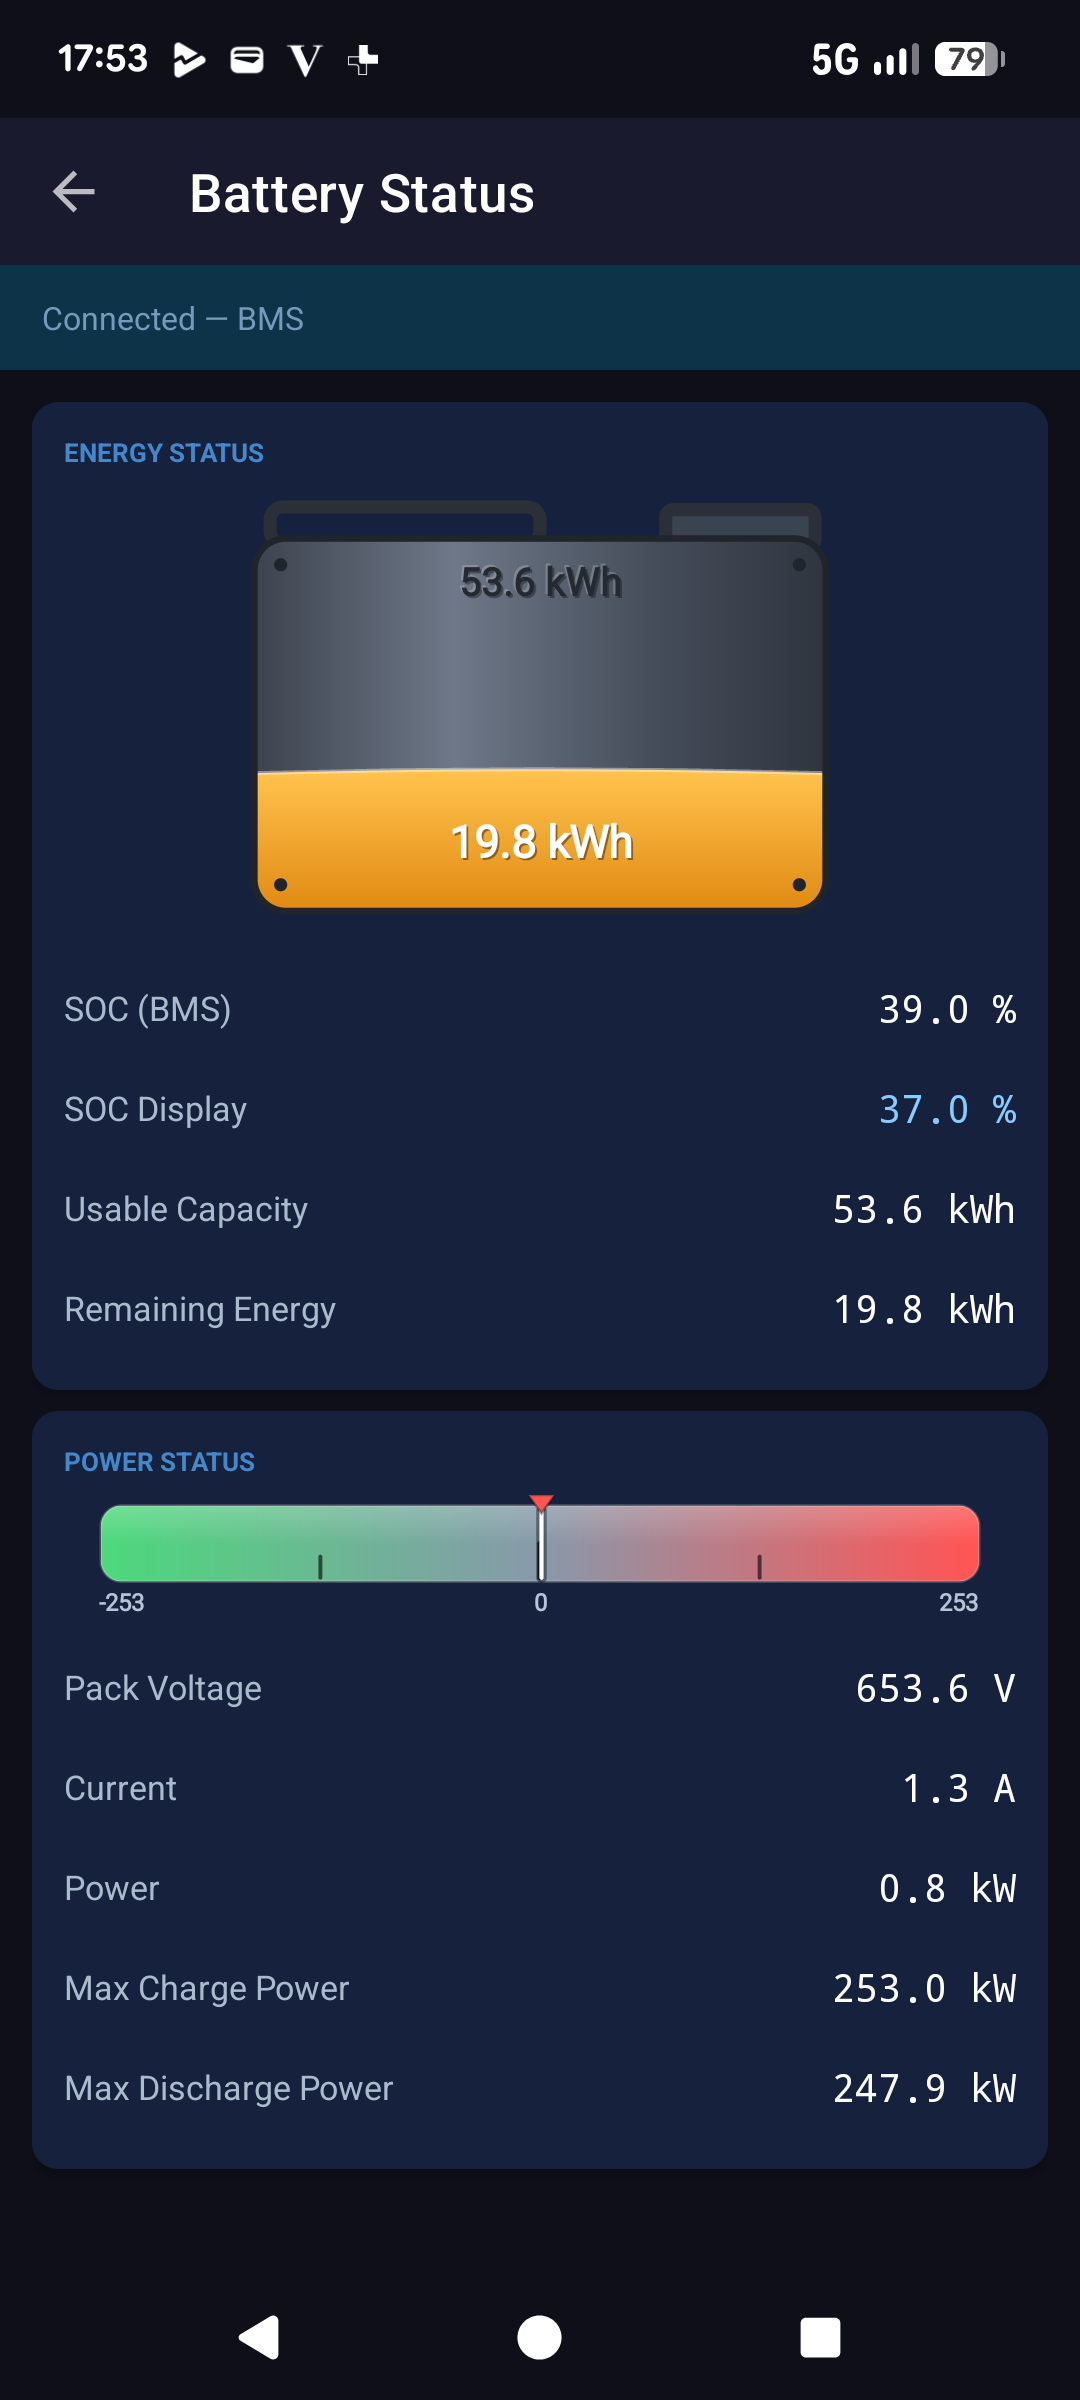
The Battery Status screen gives you the whole high-voltage battery at a glance. The "fuel tank" graphic at the top fills like a petrol gauge, the orange level is the energy available right now (Remaining Energy in kWh) against the battery's total Usable Capacity. Below it you get SOC (BMS), the true state of charge the battery management system works with, alongside SOC (Display), the slightly buffered figure shown on the car's own cluster.
The Power Status bar is a live, two-ended dial. The pointer sits in the middle at rest and swings left into the green when energy is flowing into the battery (regenerative braking or charging) and right into the red when power is being drawn out (accelerating). The ends of the scale match the battery's current limits, so you can instantly see how hard the pack is working relative to what it will allow.
Reading it: centre = coasting/parked · left = charging / regen · right = discharging (driving). The further the pointer travels, the higher the kW. Max Charge / Discharge Power below show the ceilings the BMS is allowing right now, which is why charging or regen can feel reduced when the pack is cold.
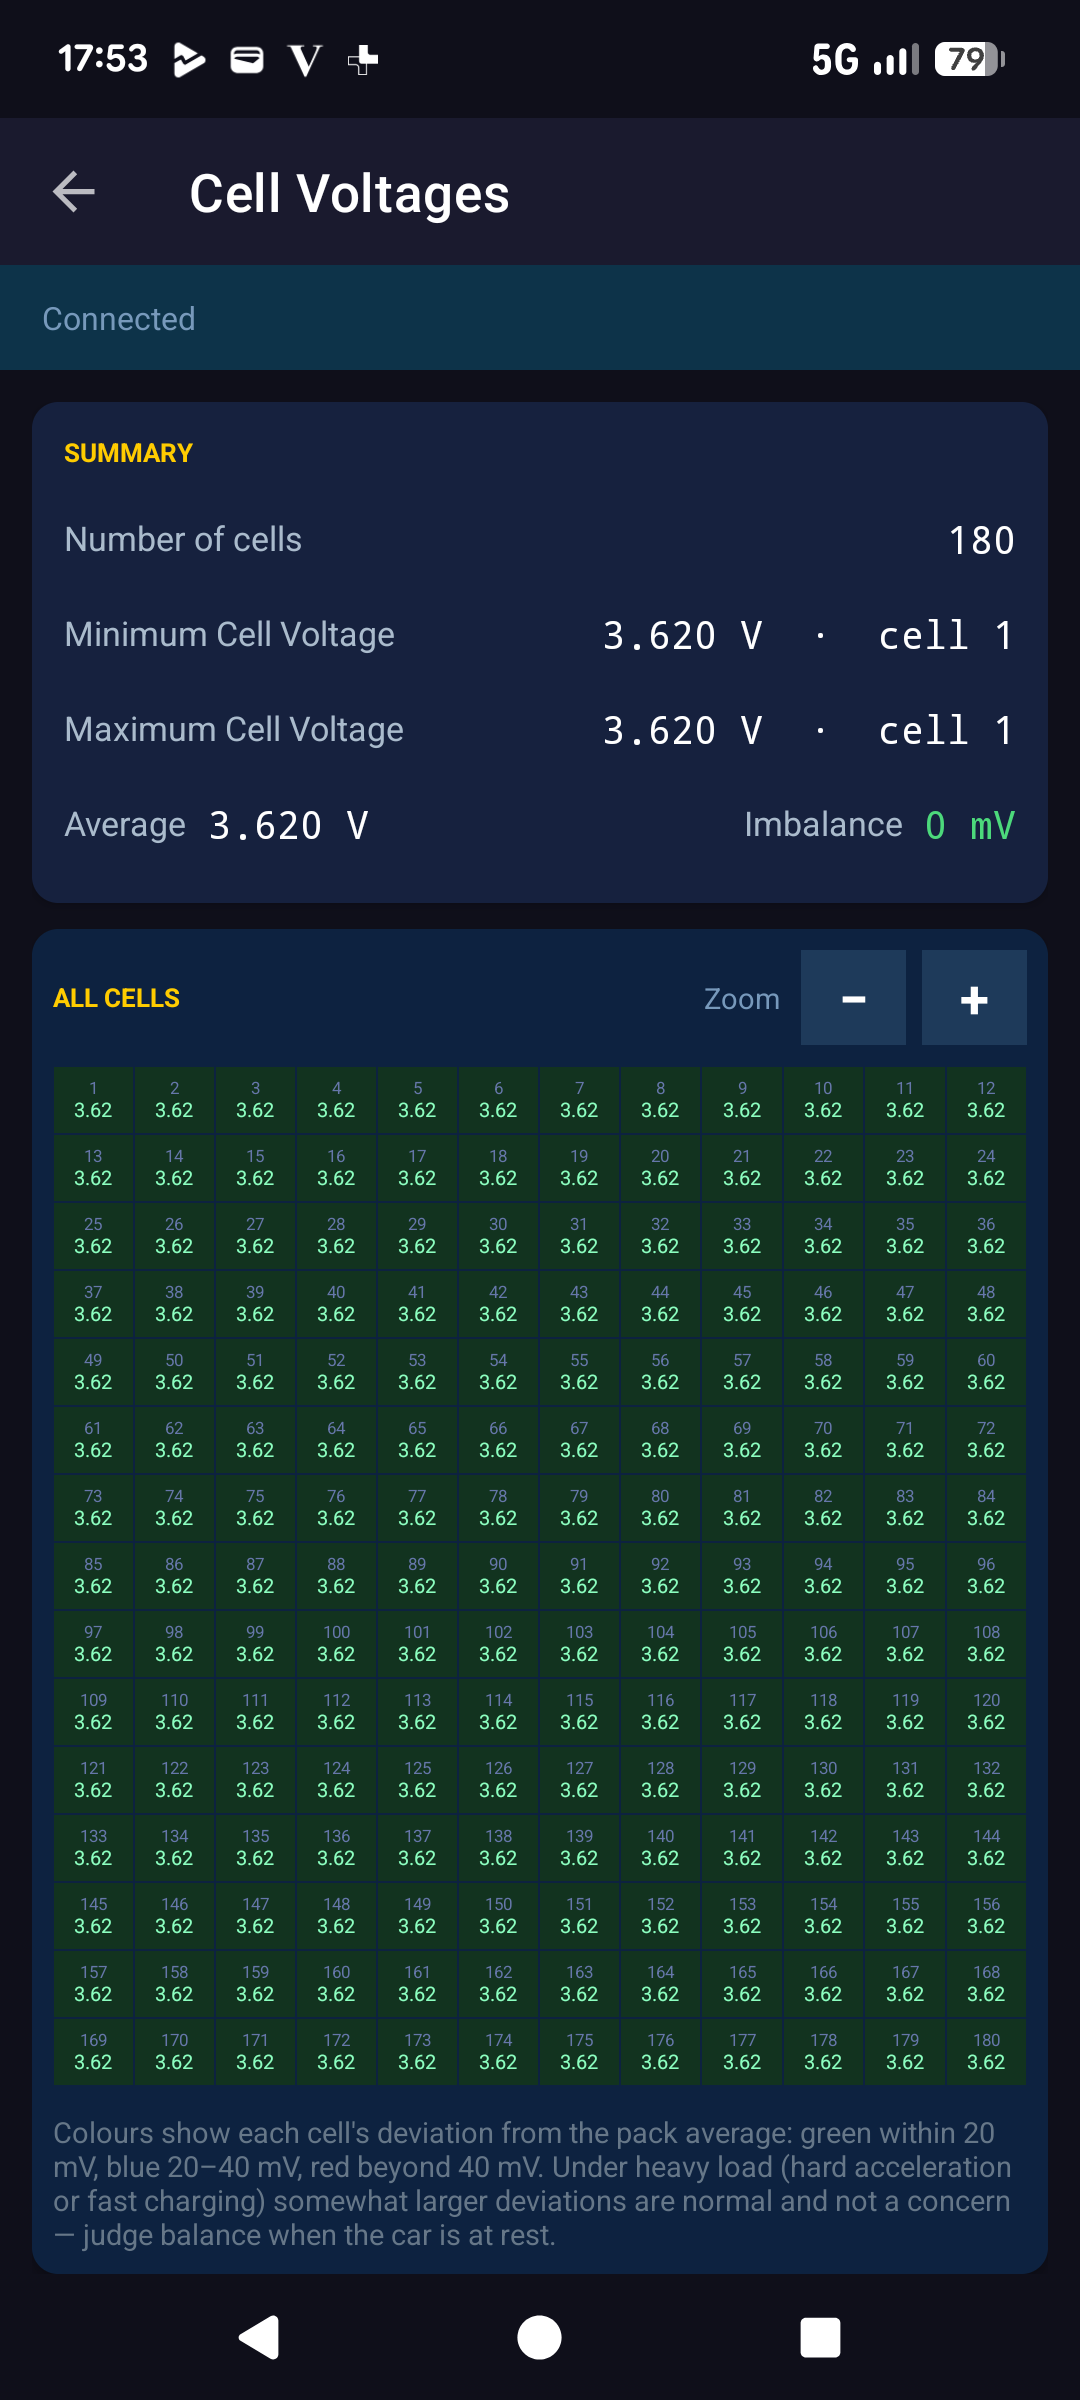
The IONIQ 5 battery pack contains a long string of individual lithium cells. This screen shows the voltage of every single cell on a colour-coded grid. The colour is not the raw voltage but each cell's deviation from the pack average: cells close to average stay green, while cells that sit increasingly above or below the average shift towards red, so an outlier drifting away from the pack jumps straight out at you. You can zoom into the grid to read individual cells more comfortably.
The summary shows the minimum, maximum and average cell voltage plus the imbalance, the gap between the strongest and weakest cell. A few millivolts of imbalance is perfectly normal; a large or steadily growing gap is the earliest sign of a tiring cell, often long before the overall State of Health moves.
It is most revealing right after a long drive or a fast-charge session, when any weak cell has the hardest time keeping up with the rest of the pack.
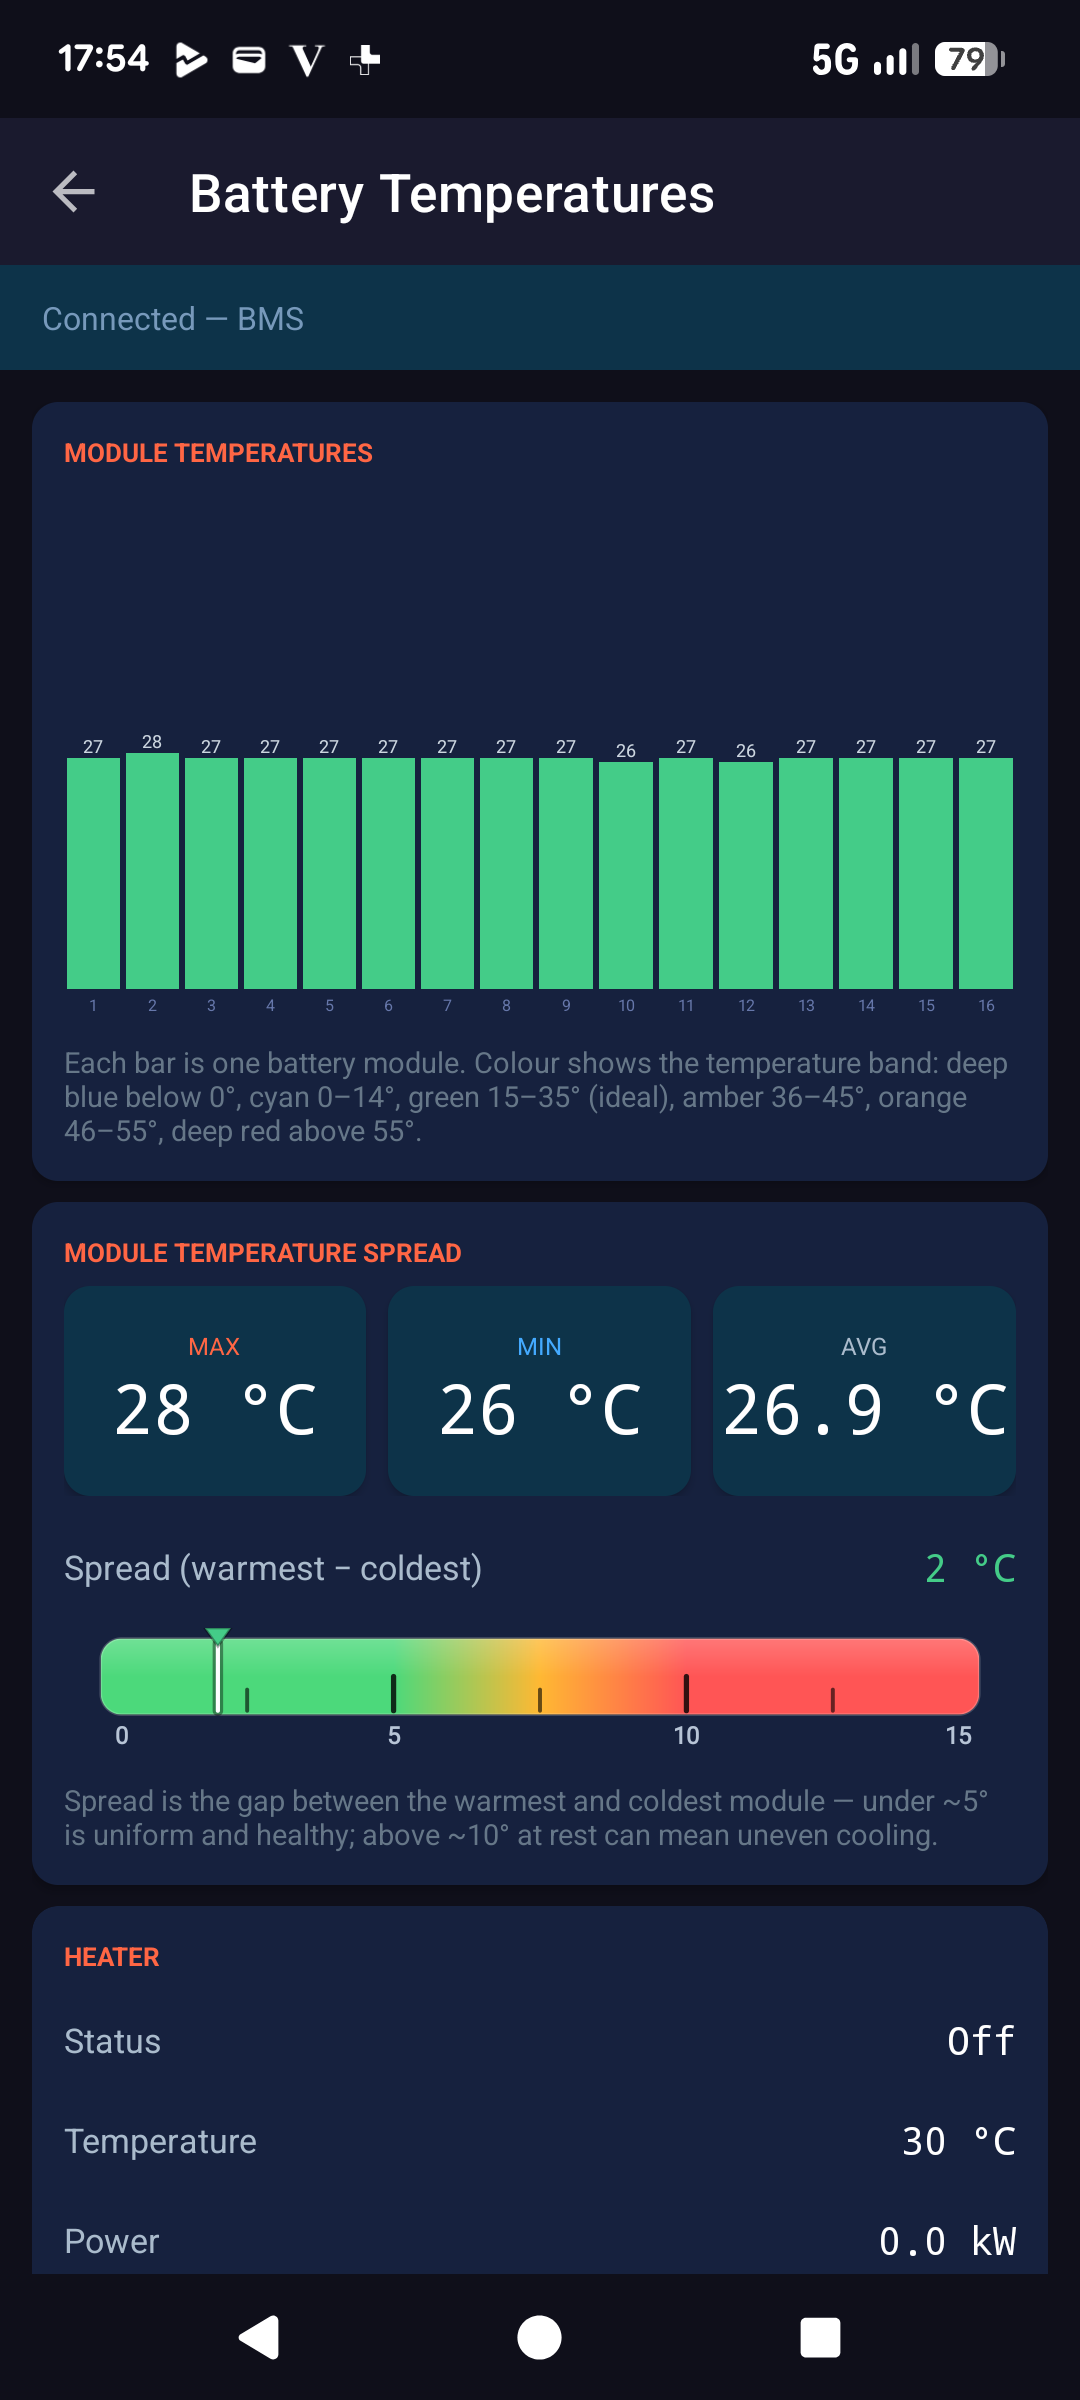
Temperature drives charging speed, range and battery longevity. The top chart shows one bar per battery module, and each bar is colour-banded by temperature: deep blue below 0°, cyan 0–14°, green 15–35° (the ideal window), amber 36–45°, orange 46–55° and deep red above 55°. One glance tells you whether the whole pack is in its happy zone.
Below the modules, the Spread dial shows the gap between the warmest and coldest module on a 0–15°C scale that runs green → red.
Reading it: under ~5°C of spread is uniform and healthy; above ~10°C while the car is at rest can point to uneven cooling worth keeping an eye on. The Heater section then shows whether battery pre-conditioning is active, its temperature and how much power it is drawing, exactly what the car does before a winter fast charge.
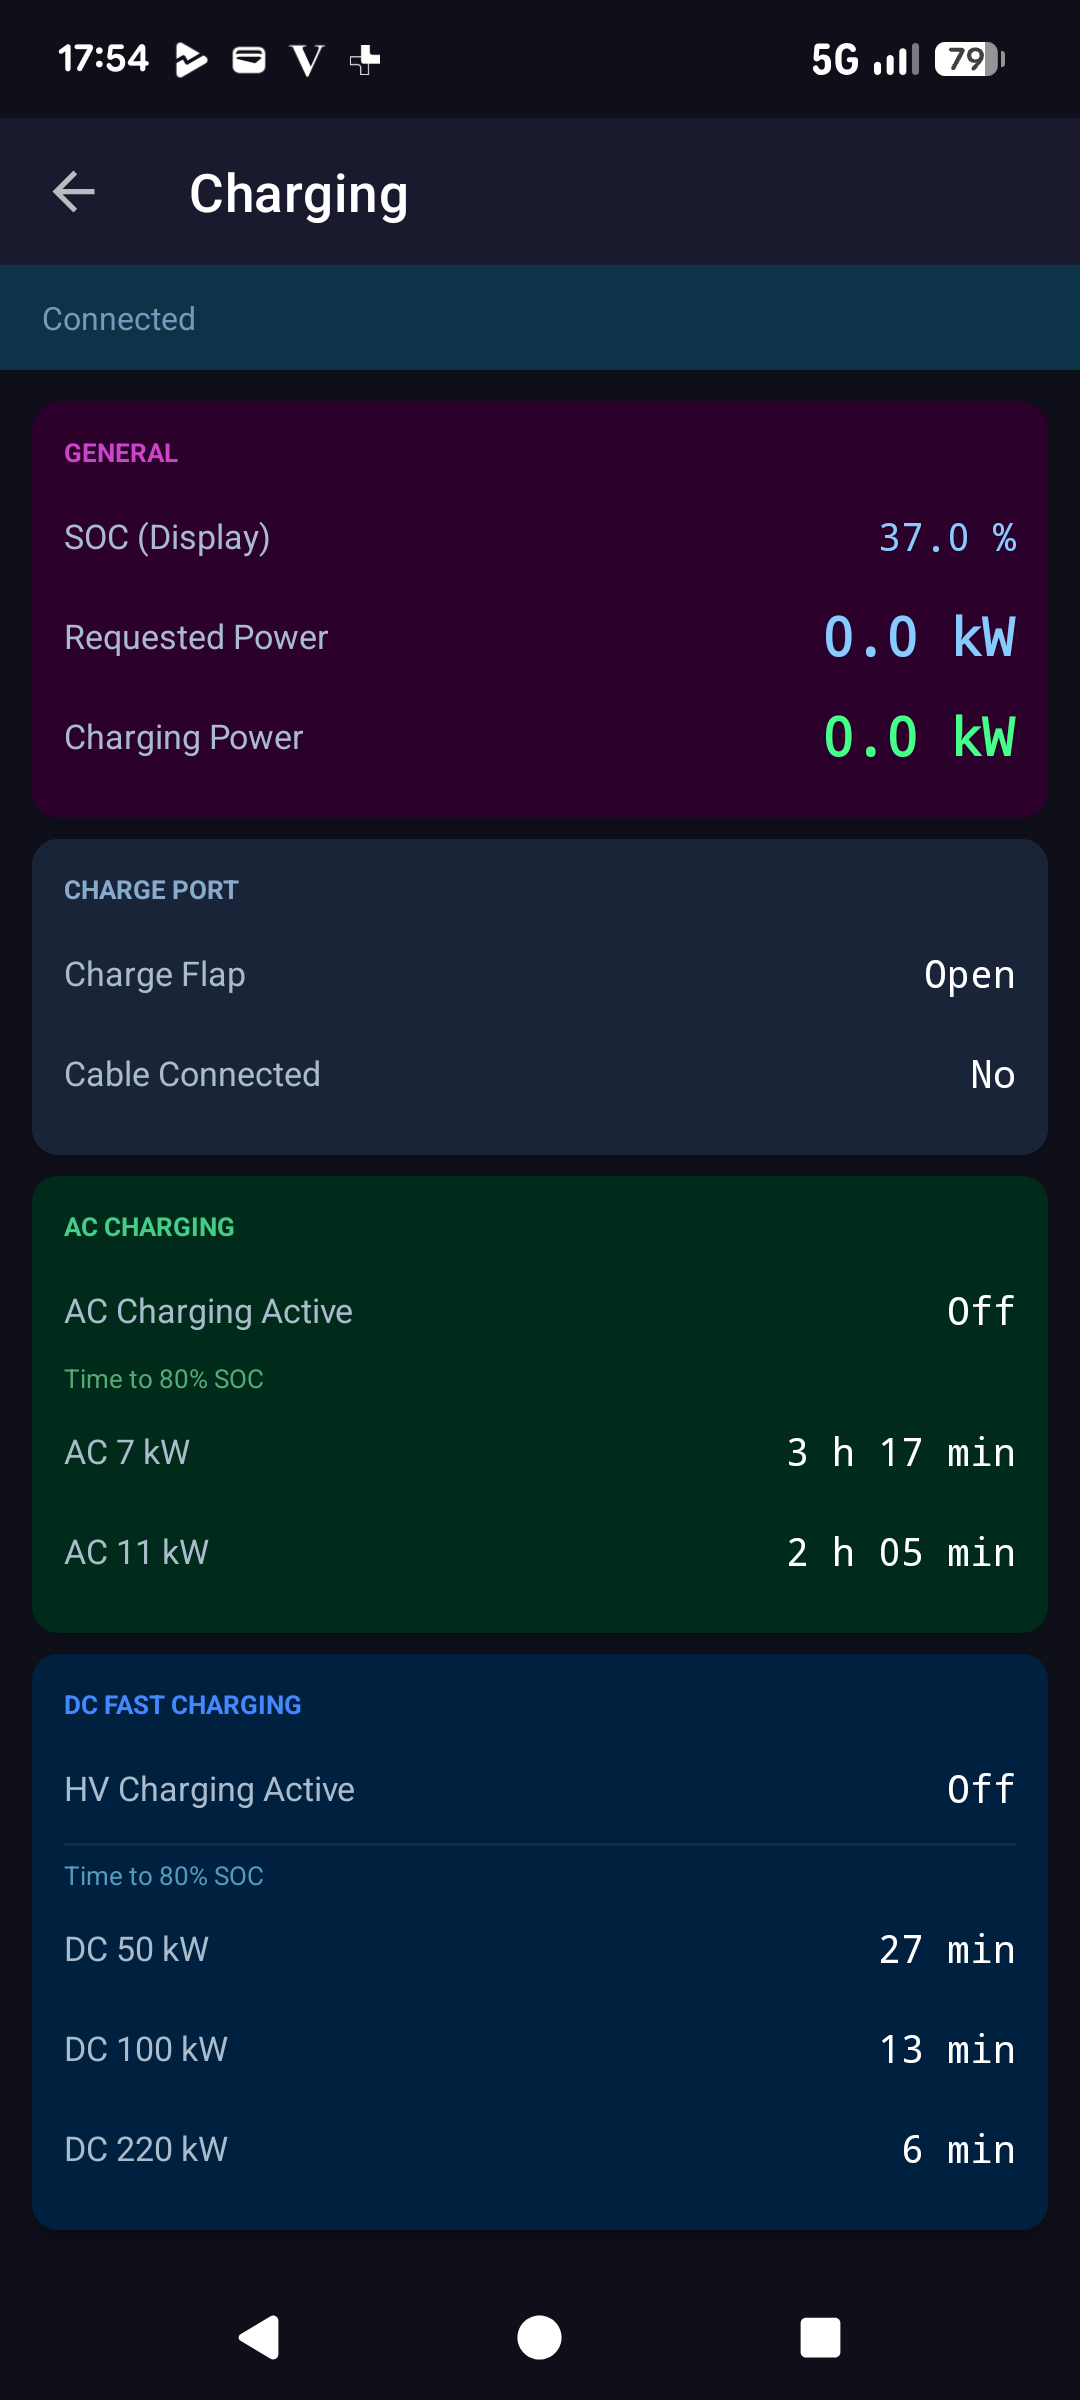
The Charging screen is your go-to view whenever you plug in. The General section shows the display state of charge, the requested power and the actual charging power flowing into the pack. The Charge Port section reports, straight from the car, whether the charge flap is open and whether a cable is connected, real signals rather than guesses.
Separate AC and DC fast charging sections each tell you whether that mode is active and, most usefully, the estimated time to 80% SOC for a range of charger powers, AC 7 kW and 11 kW, and DC 50, 100 and 220 kW. These are calculated live from your current charge level, so you always know roughly how long the wait will be at the charger in front of you.
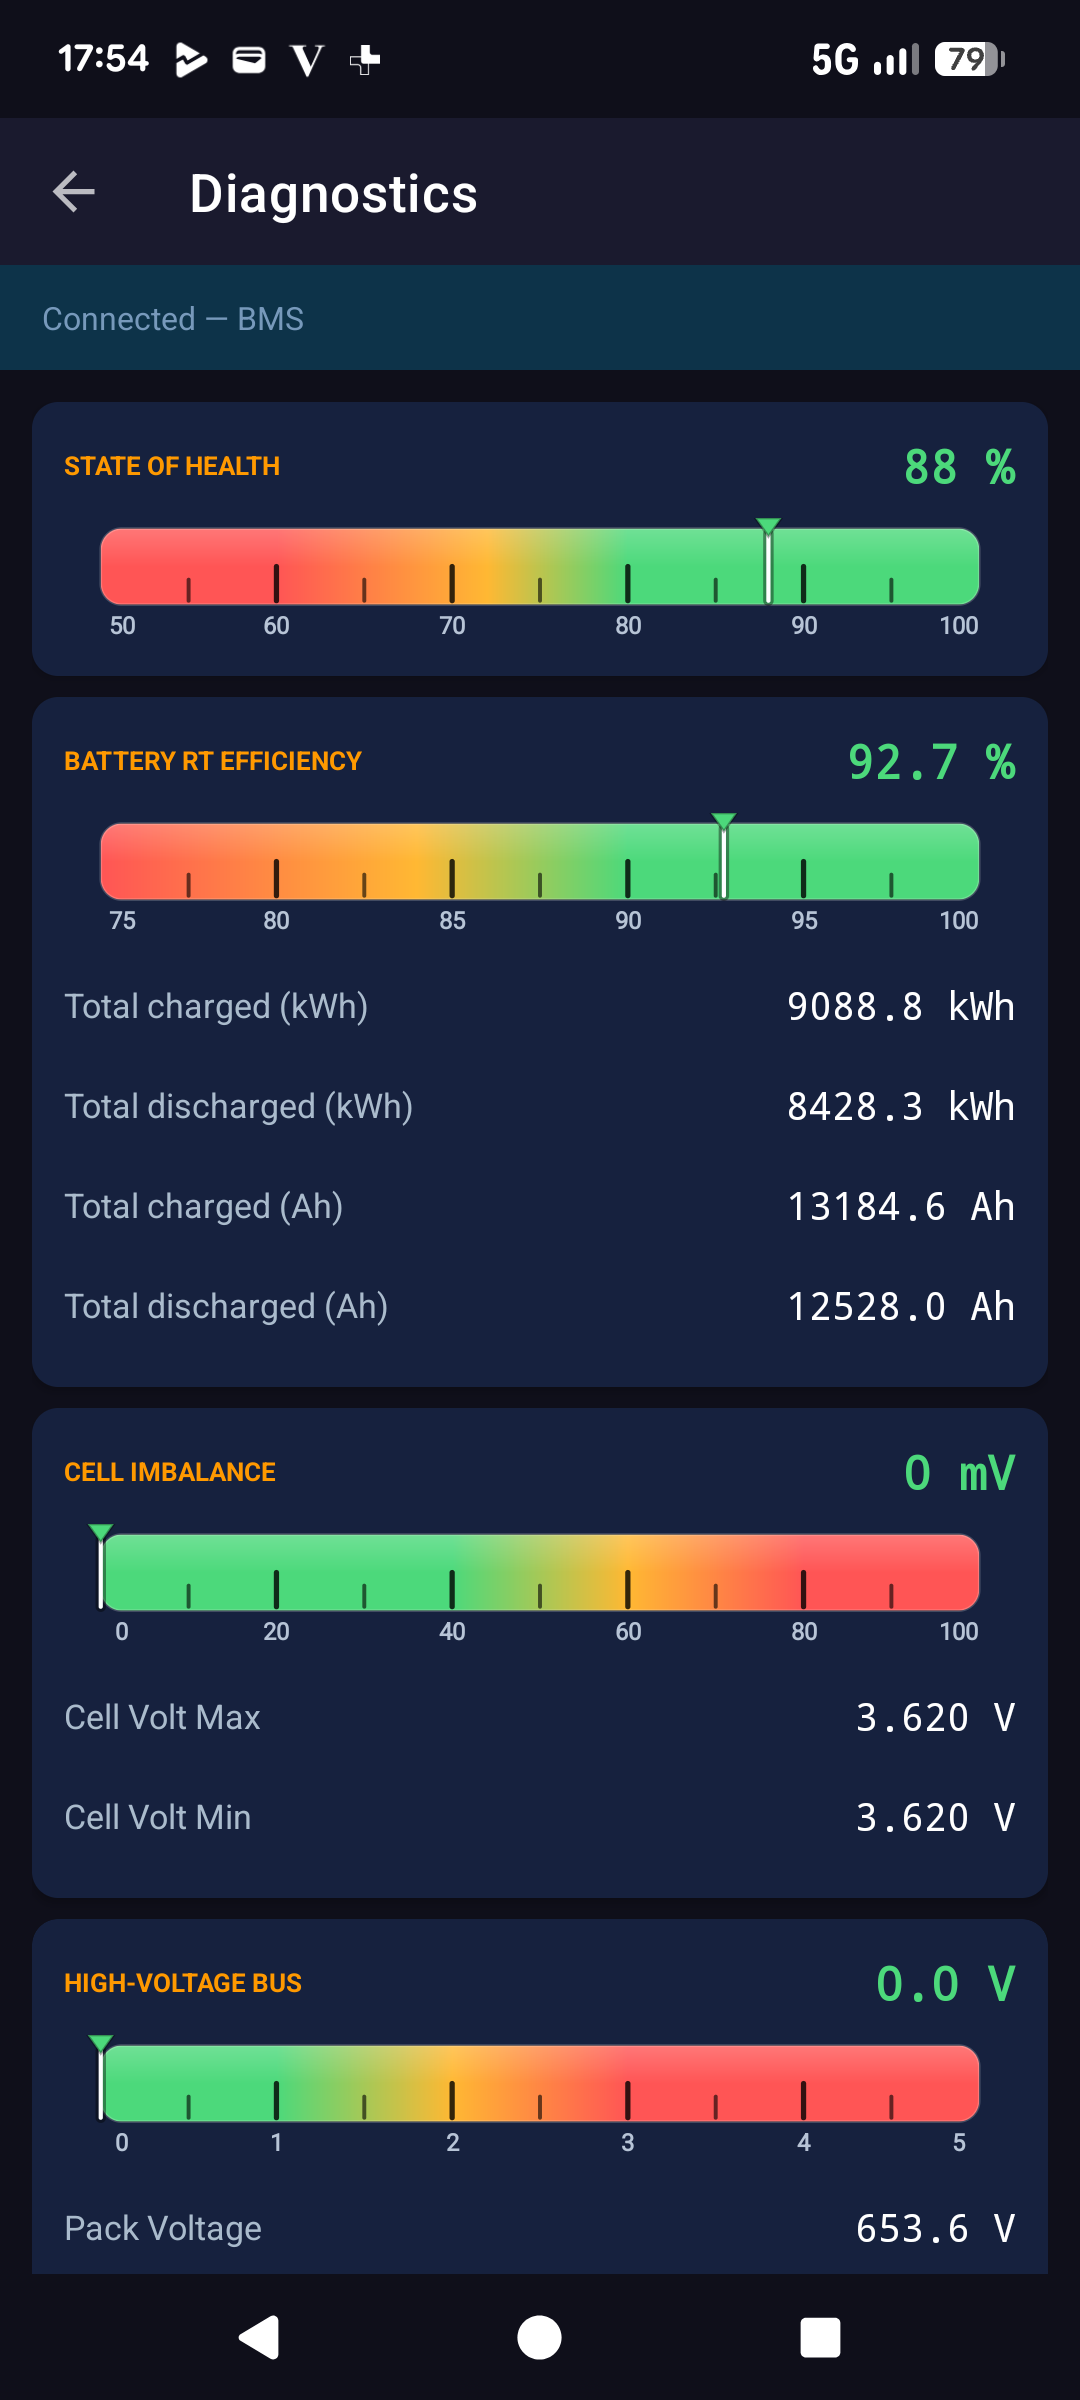
The Diagnostics screen turns the most important health figures into a stack of colour-graded dials so you can judge the pack's condition in seconds, plus the lifetime energy totals the battery management system keeps internally.
State of Health (50–100%) is how much of the original capacity the pack has kept, fuller and greener is better. Battery Round-Trip Efficiency (50–100%) is the energy you get back out versus what you put in, again greener is better. Cell Imbalance (0–100 mV) works the other way: here low and green is healthy and a long red bar means the cells are drifting apart.
The High-Voltage Bus dial shows the DC-link gap: the battery pack voltage minus the inverter's DC-link capacitor voltage while the main contactor is closed, on a 0–5 V scale. With the bus live the capacitor sits right across the pack, so this gap is essentially the small voltage drop across the contactor and busbars — lower and greener is better. A reading near 0 V (green) means a healthy, well-connected bus, while a growing gap (amber → red) points to extra resistance in the high-voltage path. When the bus is not live (main contactor open, car asleep) the dial simply shows a dash. The pack voltage, capacitor voltage and link status are listed beside it.
A separate Insulation Resistance dial tracks the electrical isolation between the high-voltage system and the car body — a key safety indicator, where higher is better (a healthy pack reads well above 1000 kΩ).
Rule of thumb: for the "higher is better" dials (health, efficiency) you want the needle well into the green on the right; for Cell Imbalance you want it low on the left. The figures underneath, lifetime charged / discharged kWh and Ah, max and min cell voltage and insulation resistance, give the hard numbers behind the dials, and error flags light up if the BMS ever records an over- or under-voltage event.
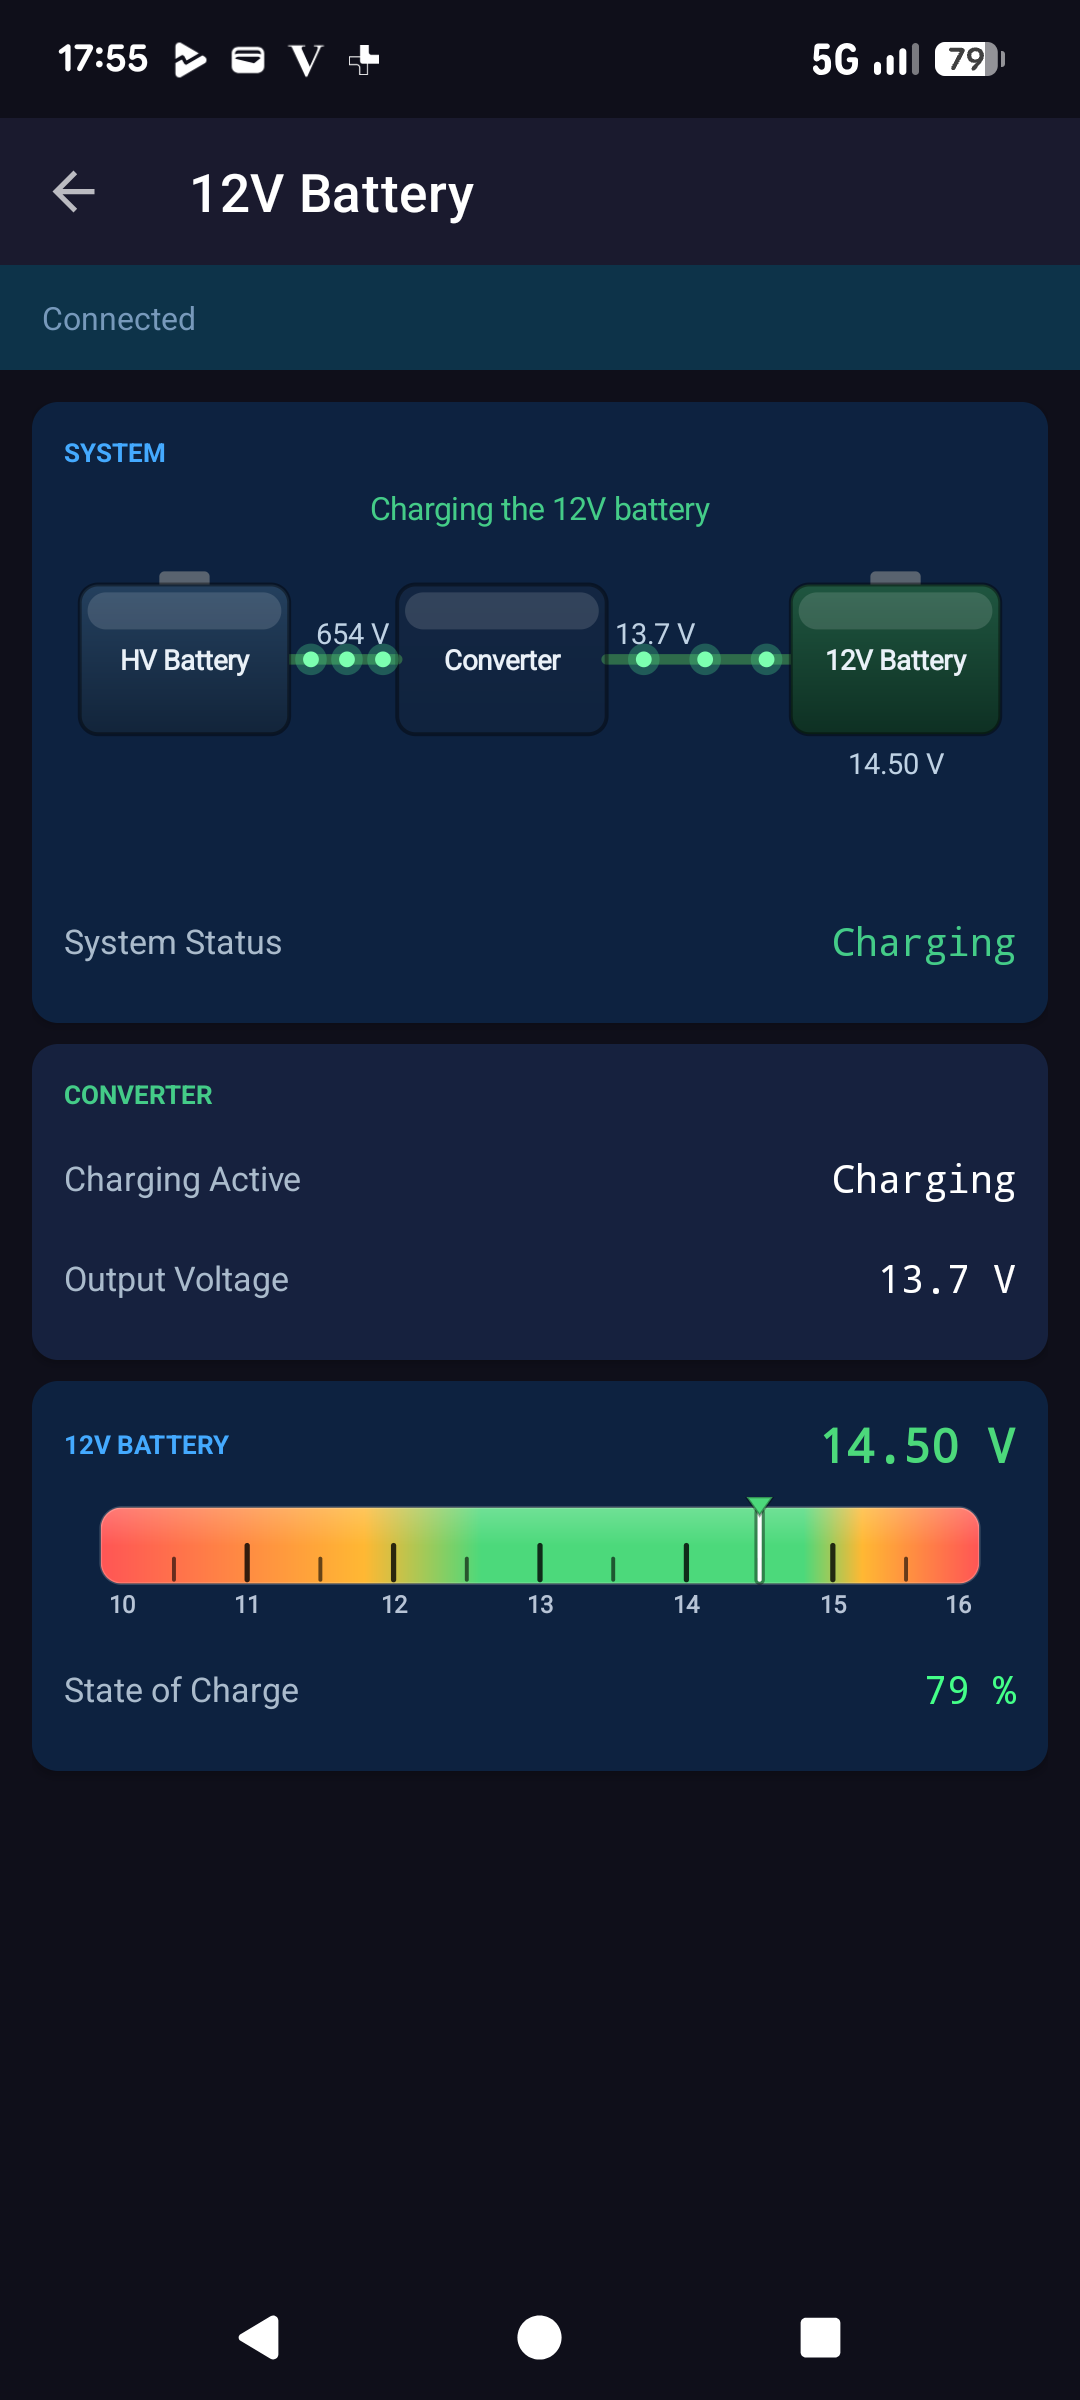
Like every car, the IONIQ 5 has a conventional 12V battery that powers the electronics when the high-voltage system is asleep, and a weak 12V battery is a common cause of mystery warning lights and no-start mornings. The top of the screen draws the power-flow diagram: high-voltage battery → DC-DC converter → 12V battery, with dots that animate along the path while the converter is topping up the 12V battery, so you can see at a glance whether it is being charged.
The voltage dial runs from 10 to 16 V with the healthy band in green and the extremes in red. Alongside it you get the converter's output voltage and the 12V battery's state of charge.
Reading it: with the car awake the converter holds the system around 13–14.5 V. A resting voltage that sags below ~12.0 V, or a state of charge that stays under ~70%, is an early warning to have the 12V battery checked before it leaves you stranded.
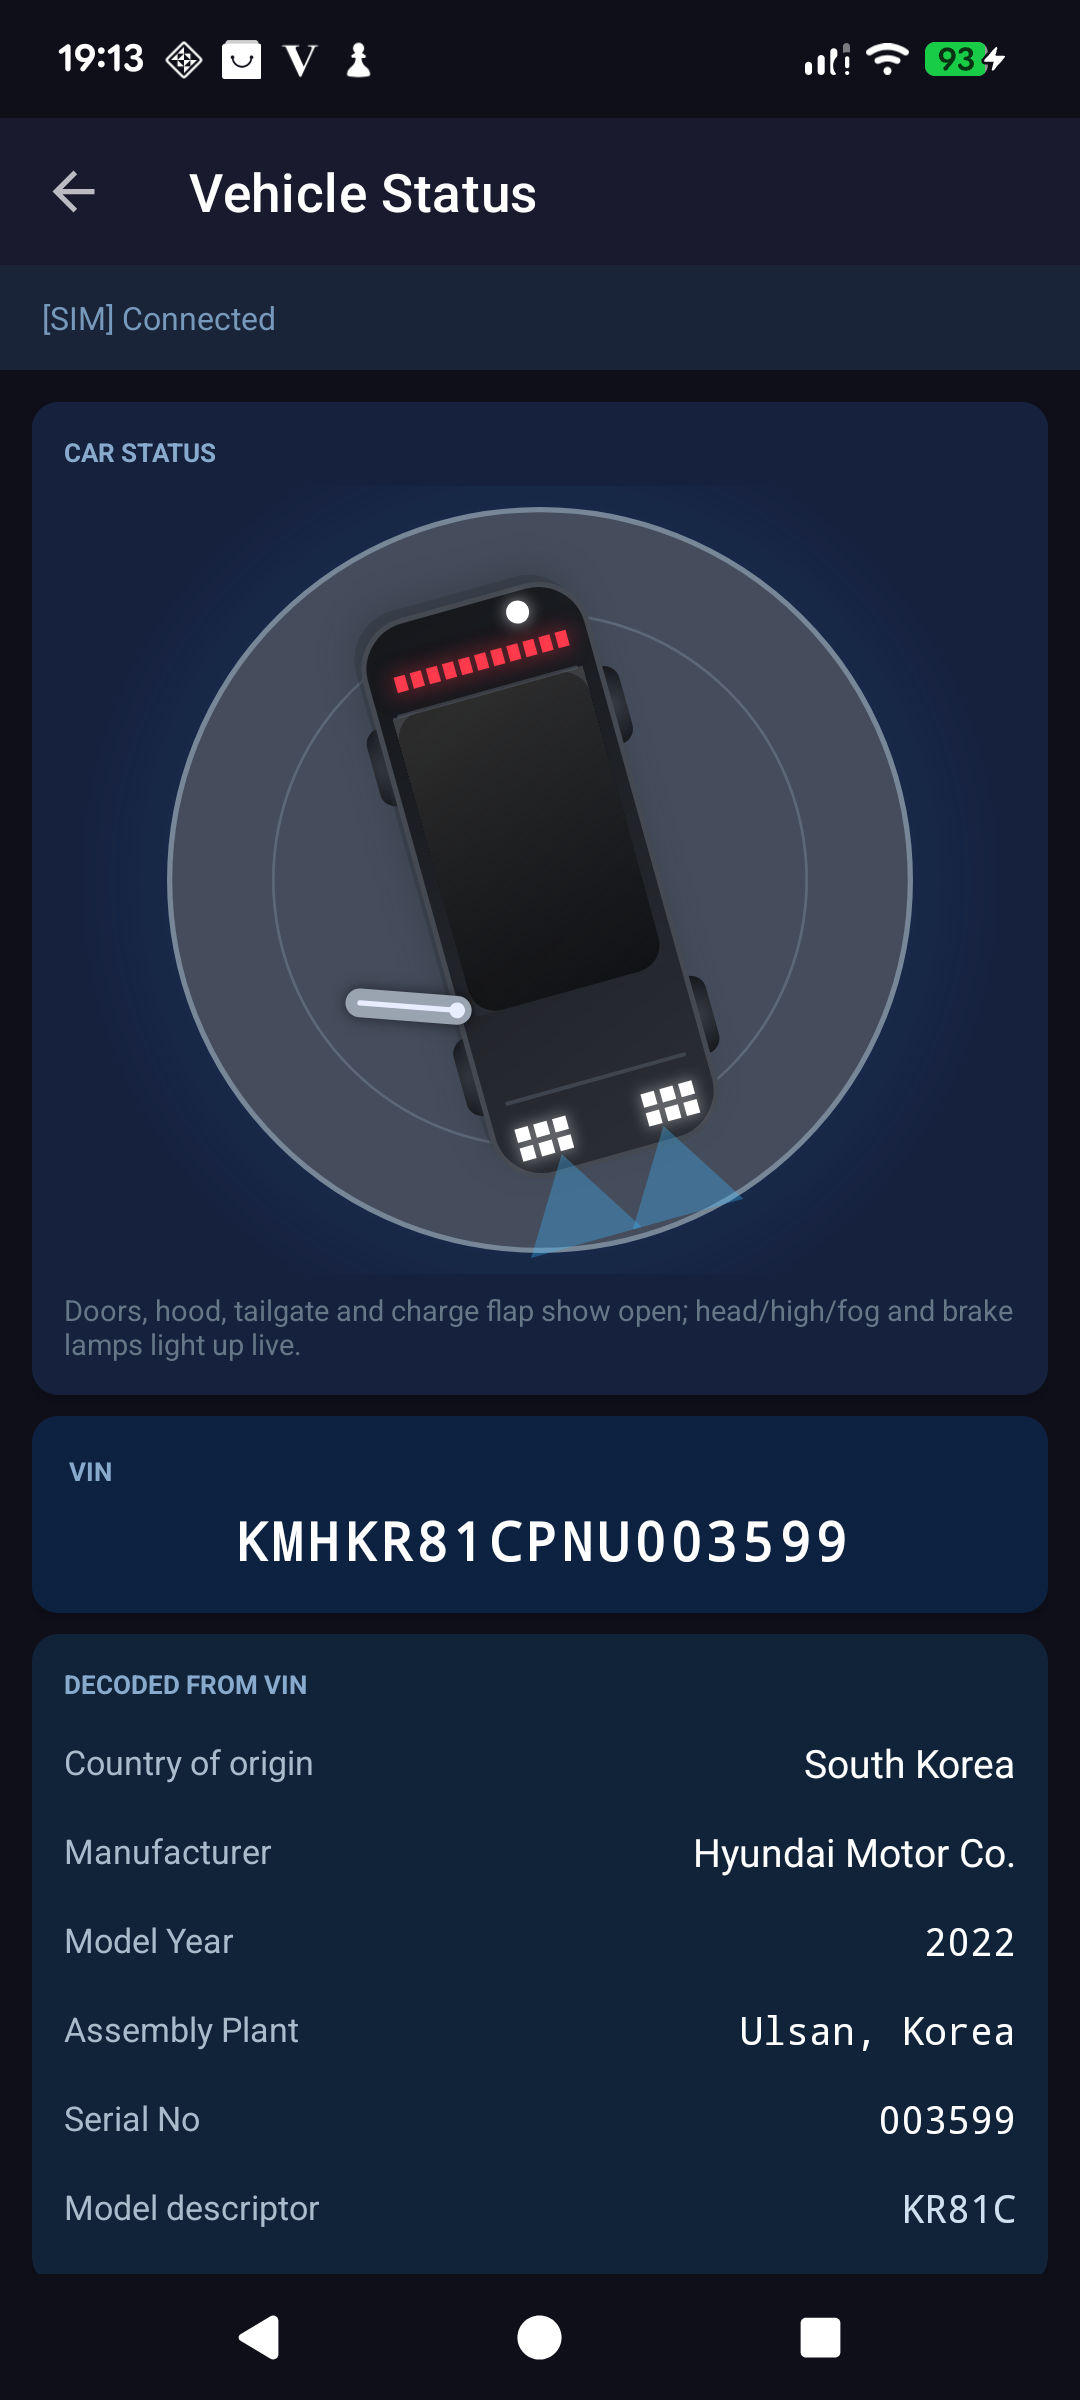
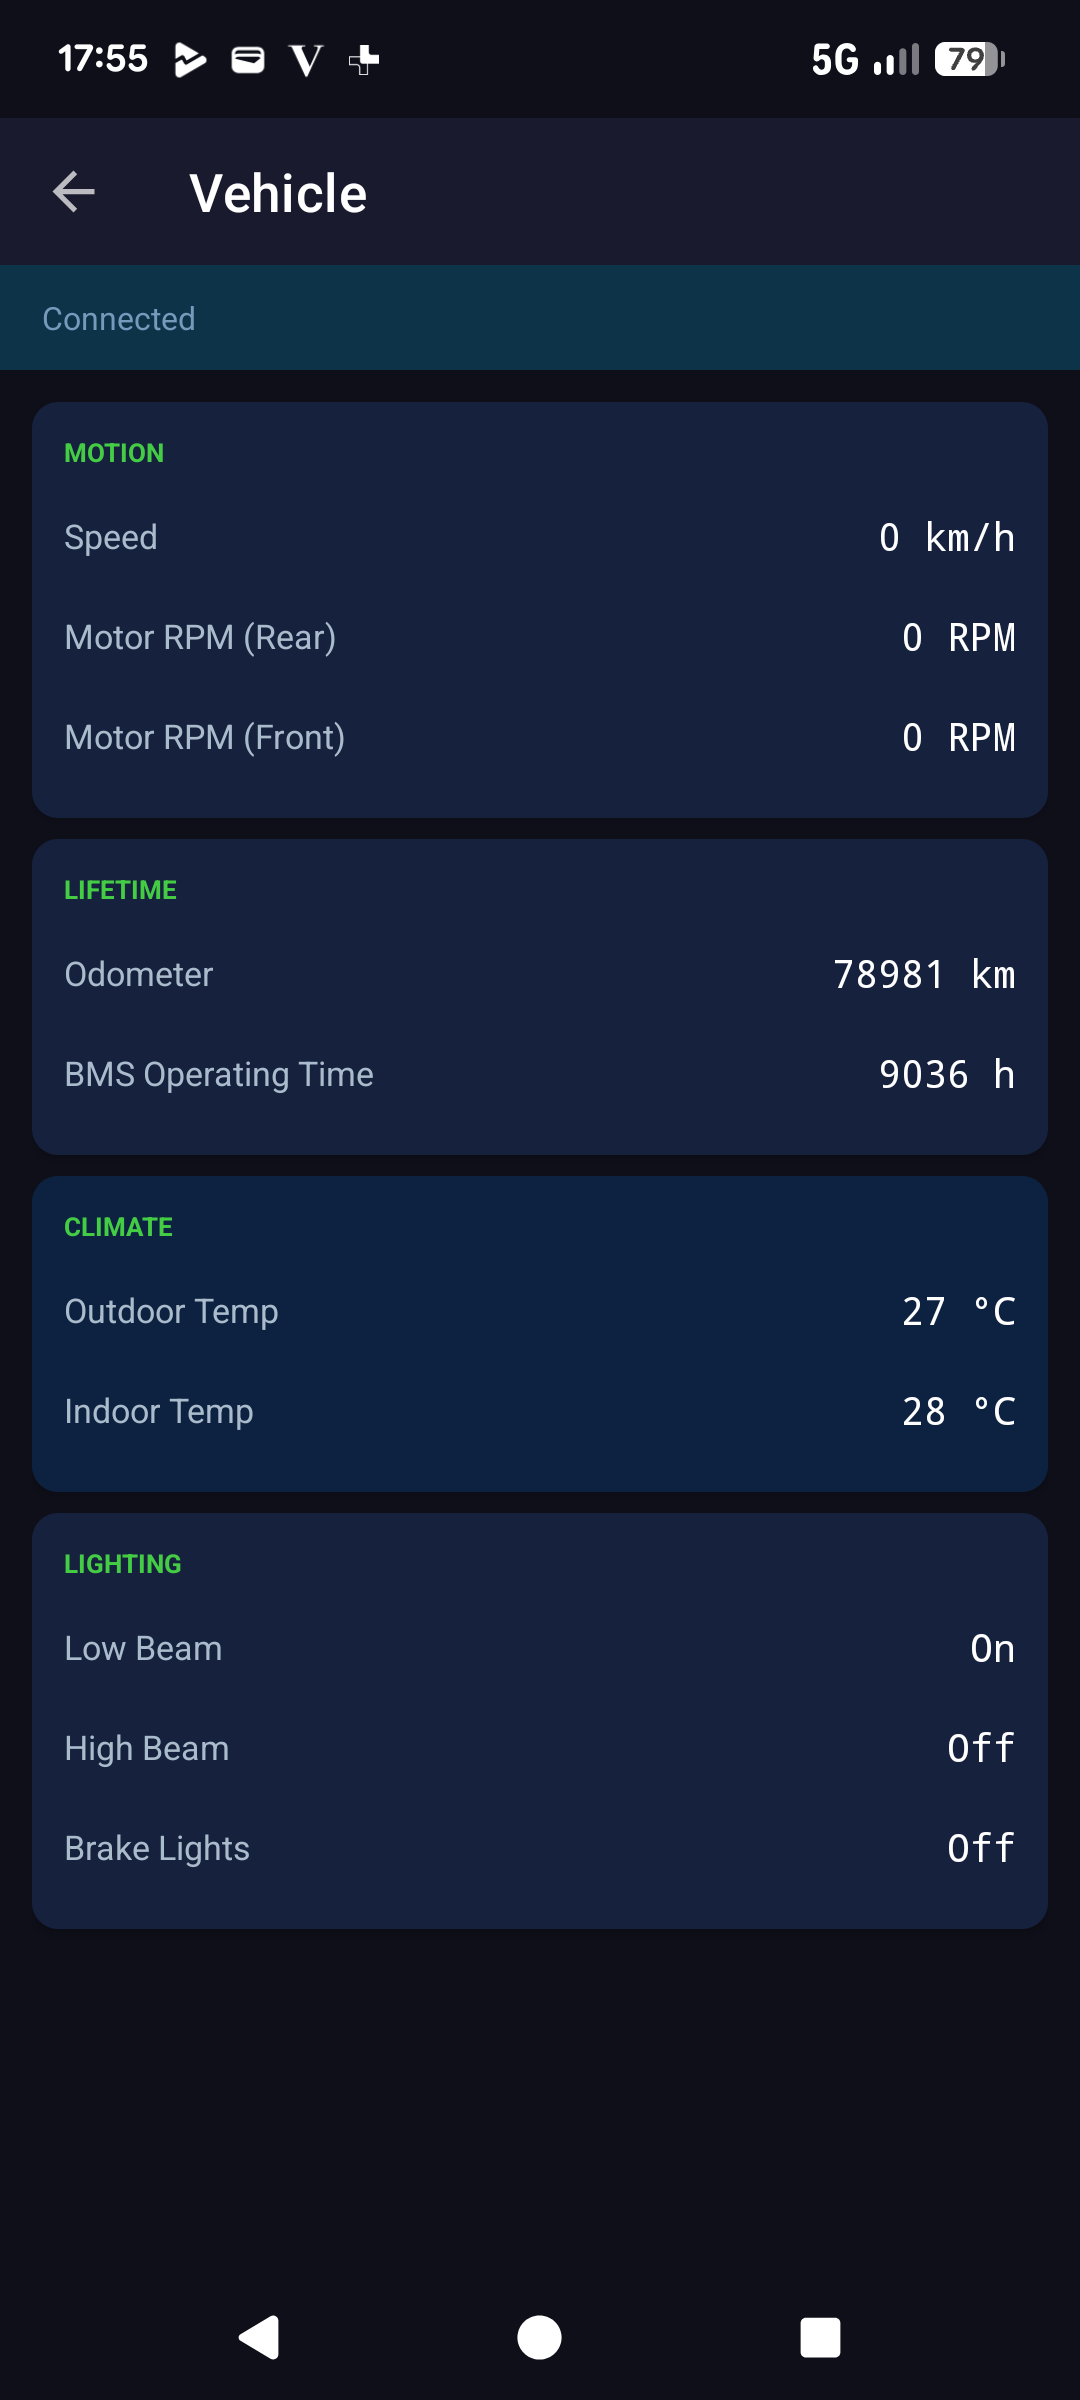
The Vehicle screen gathers the general car data that does not belong to a single system. Live motion data, speed plus rear and front motor RPM, lets you watch the drive unit work in real time, including how the front and rear motors share the job during all-wheel-drive driving.
Lifetime figures include the odometer straight from the cluster and the BMS operating hours, the total time the battery system has been awake since the car was built. The climate readouts show the car's own outdoor temperature sensor and the cabin temperature, handy context for how the battery behaves in heat or cold. Lighting status (low beam, high beam and brake lights) rounds out the picture.
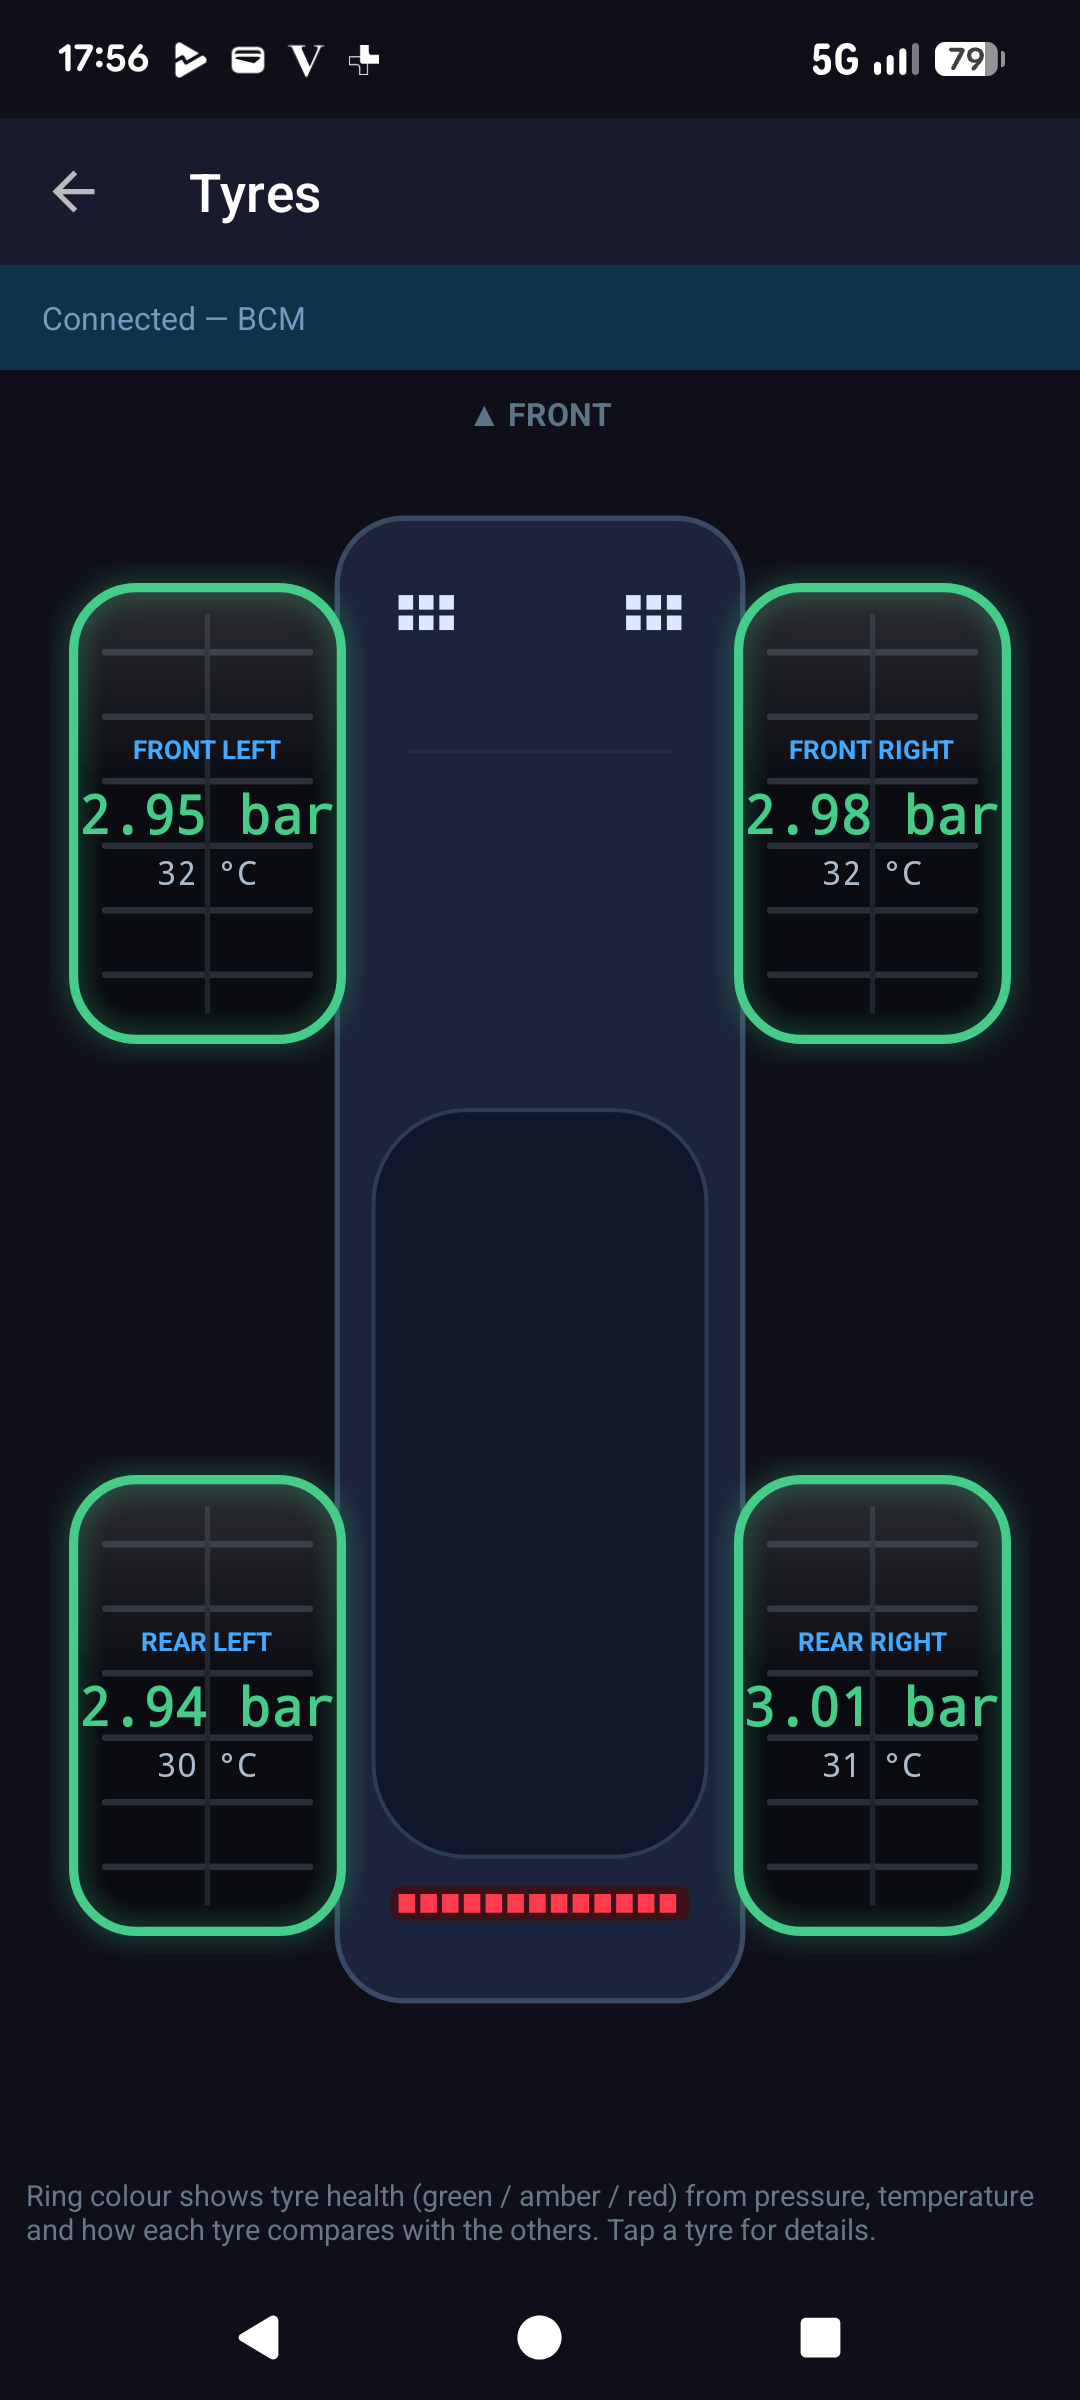
The IONIQ 5's factory Tyre Pressure Monitoring System (TPMS) tracks every wheel. This screen lays the four tyres out on a top-down picture of the car and shows each wheel's pressure and temperature in its real position, so you immediately know which corner needs attention.
Each tyre is wrapped in a coloured ring that acts as a mini dial: green is fine, amber means keep an eye on it and red means attention. The colour is judged from pressure, temperature and how each wheel compares with the other three, so an odd one out stands out even if every tyre is technically "in range".
Tap any wheel for the detailed figures, and switch the whole screen between bar and PSI with a single tap. A typical IONIQ 5 cold pressure is around 2.5 bar (36 PSI). Tyre temperature is shown per wheel too, useful for spotting a dragging brake or alignment problem.
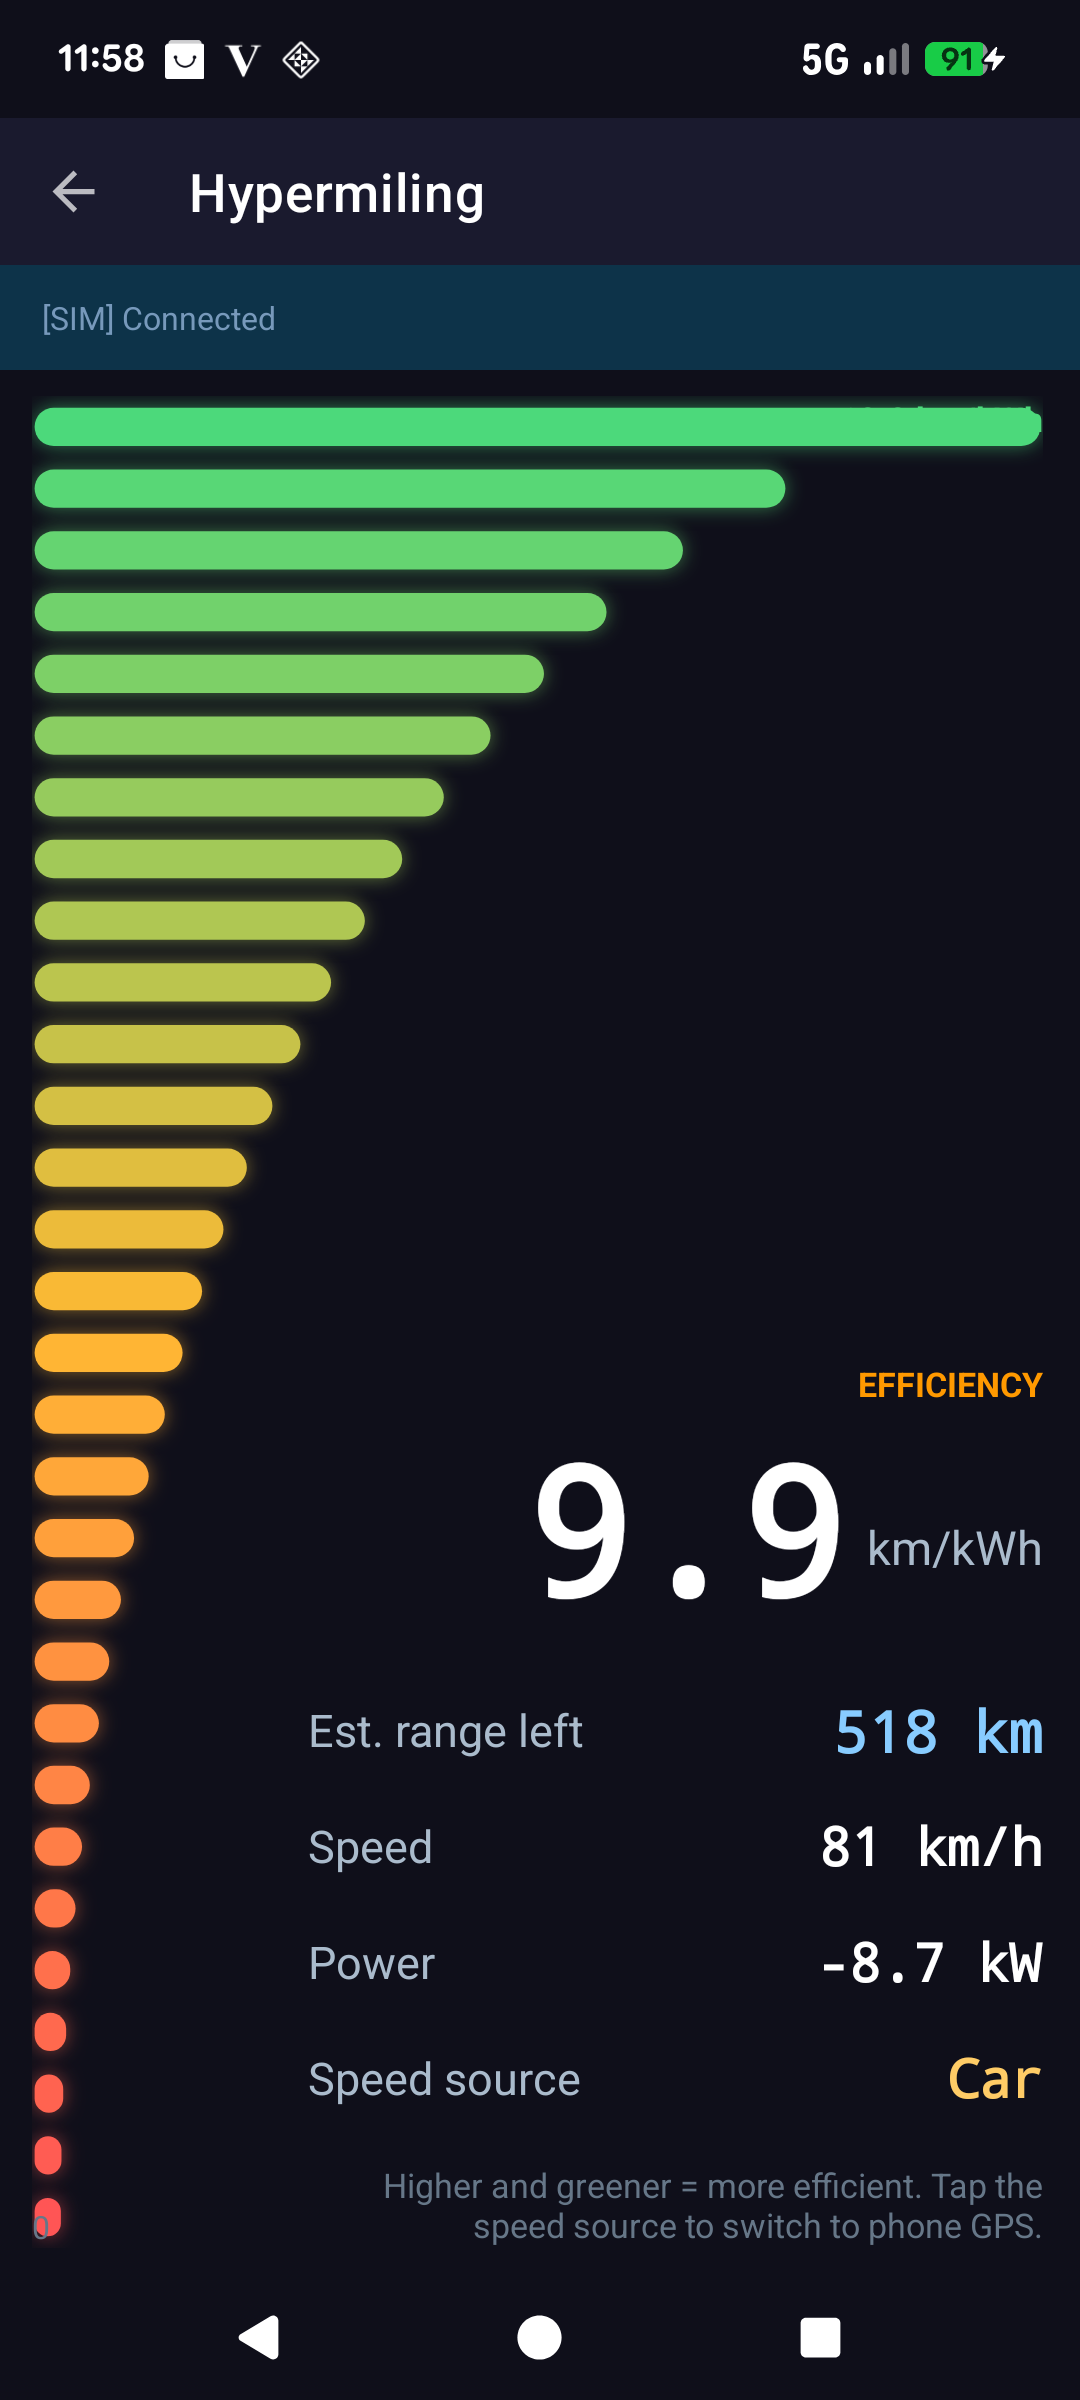
Hypermiling is a live efficiency coach that helps you squeeze more range out of every charge. The big number is your current efficiency in km/kWh, and the tall bar graph beside it is the dial: the bars fill upward and turn greener the more efficiently you drive, and drop down into amber and red when you use more energy.
Reading it: higher and greener is better. Underneath you get the estimated range left at your current efficiency, your speed and the live power (a negative value means you are recovering energy by coasting or braking). The speed source can be tapped to switch between the car's own data and your phone's GPS.
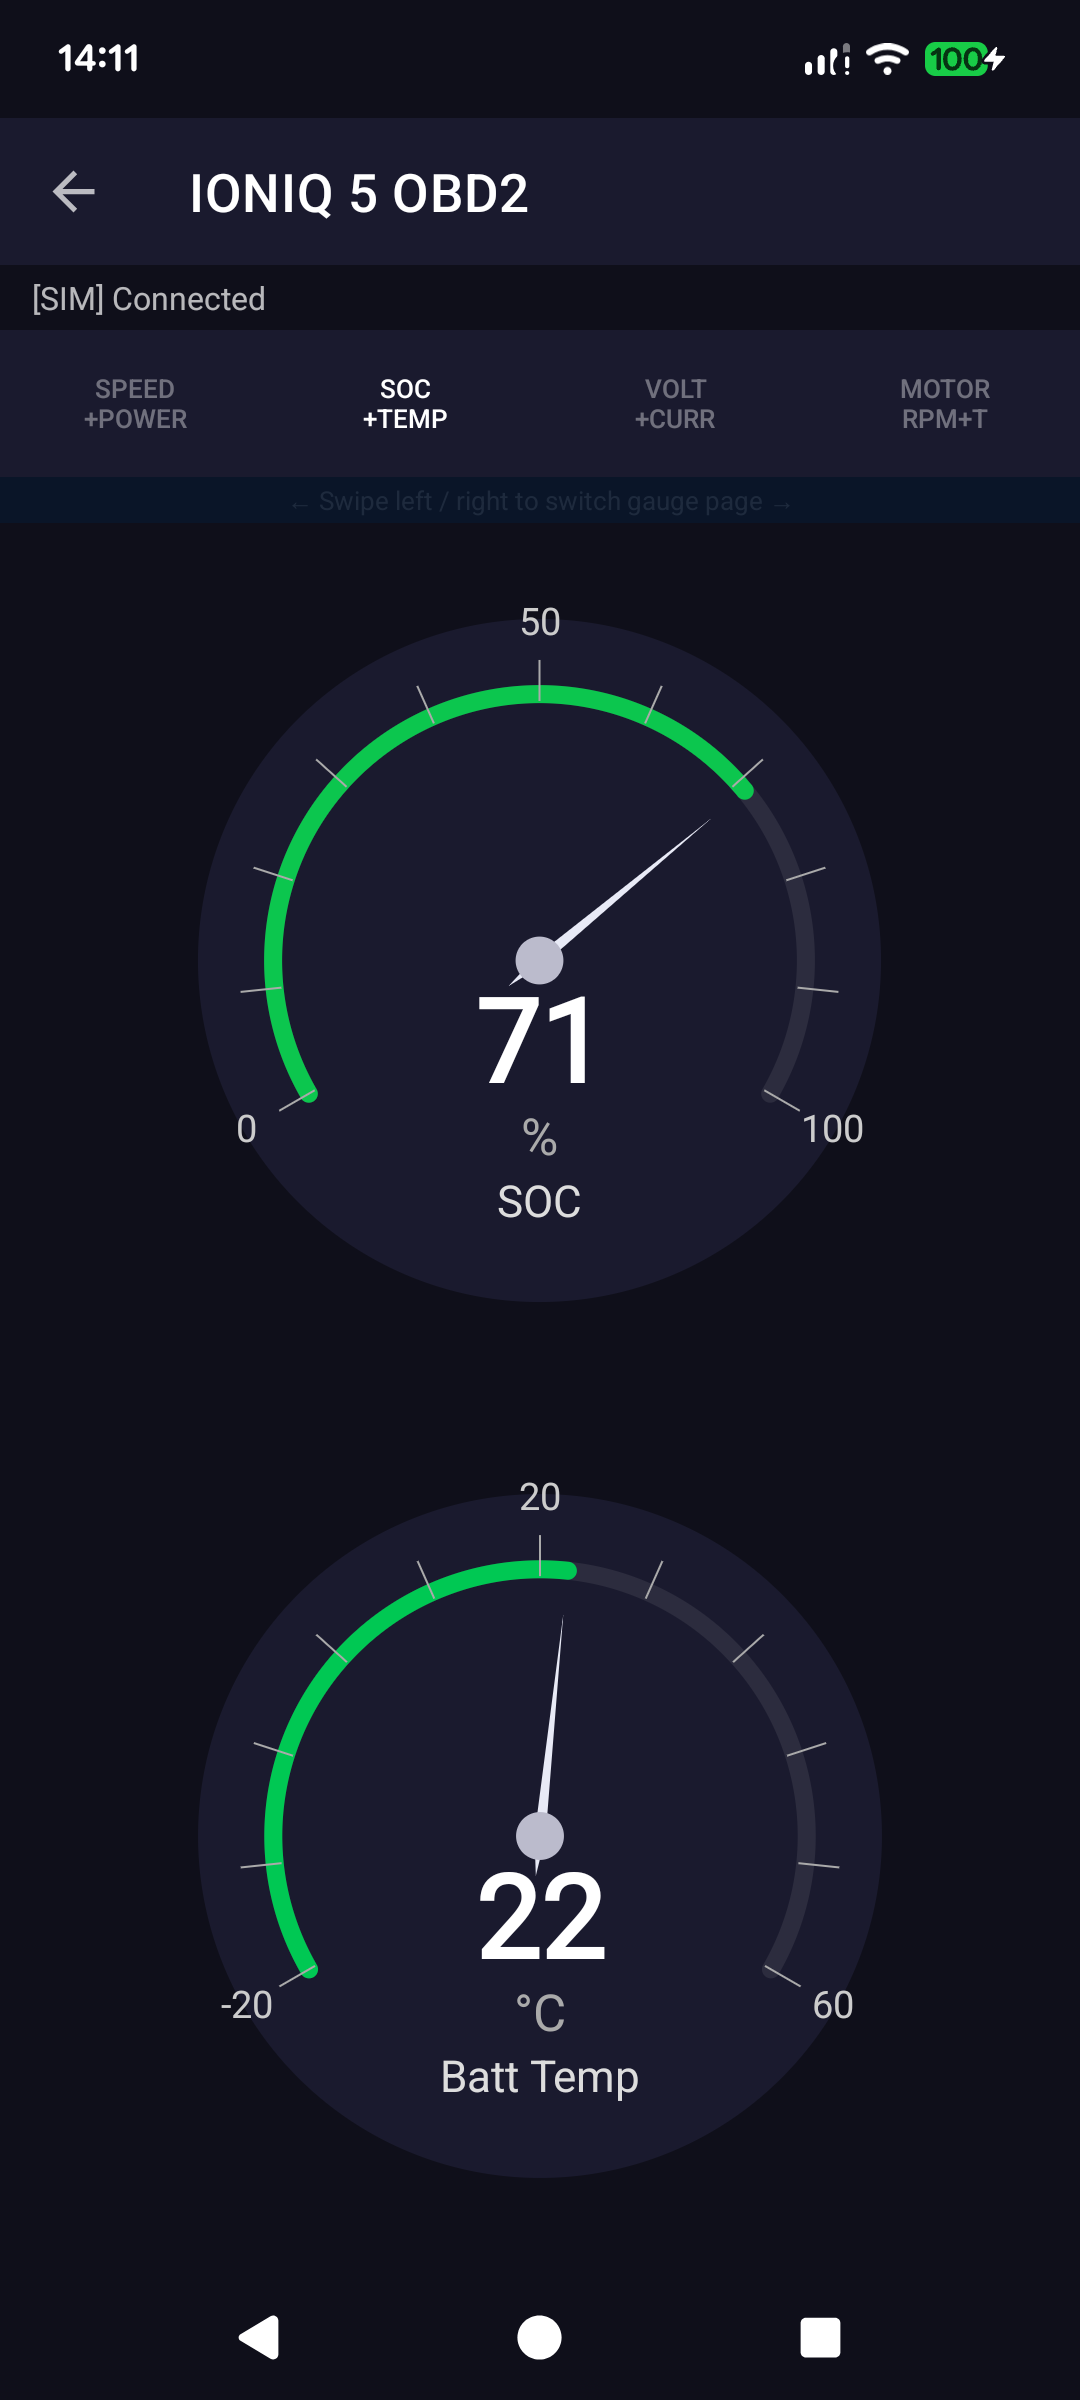
Live Gauges turns your phone into a set of big, classic needle dials, perfect for a phone mounted on the dash or for a passenger to watch. Each dial has a coloured arc and a large centre number, so the key values are readable at a glance without reading any small text.
Swipe left and right to move between four gauge pages, each showing two dials:
Speed + Power · SOC + Battery Temperature · Voltage + Current · Motor RPM + Temperature. The coloured arc fills as the value rises, giving you the same instant "where am I on the scale" feel as a physical instrument cluster.