Overview · Free tool
Current Connection
Spectrum view
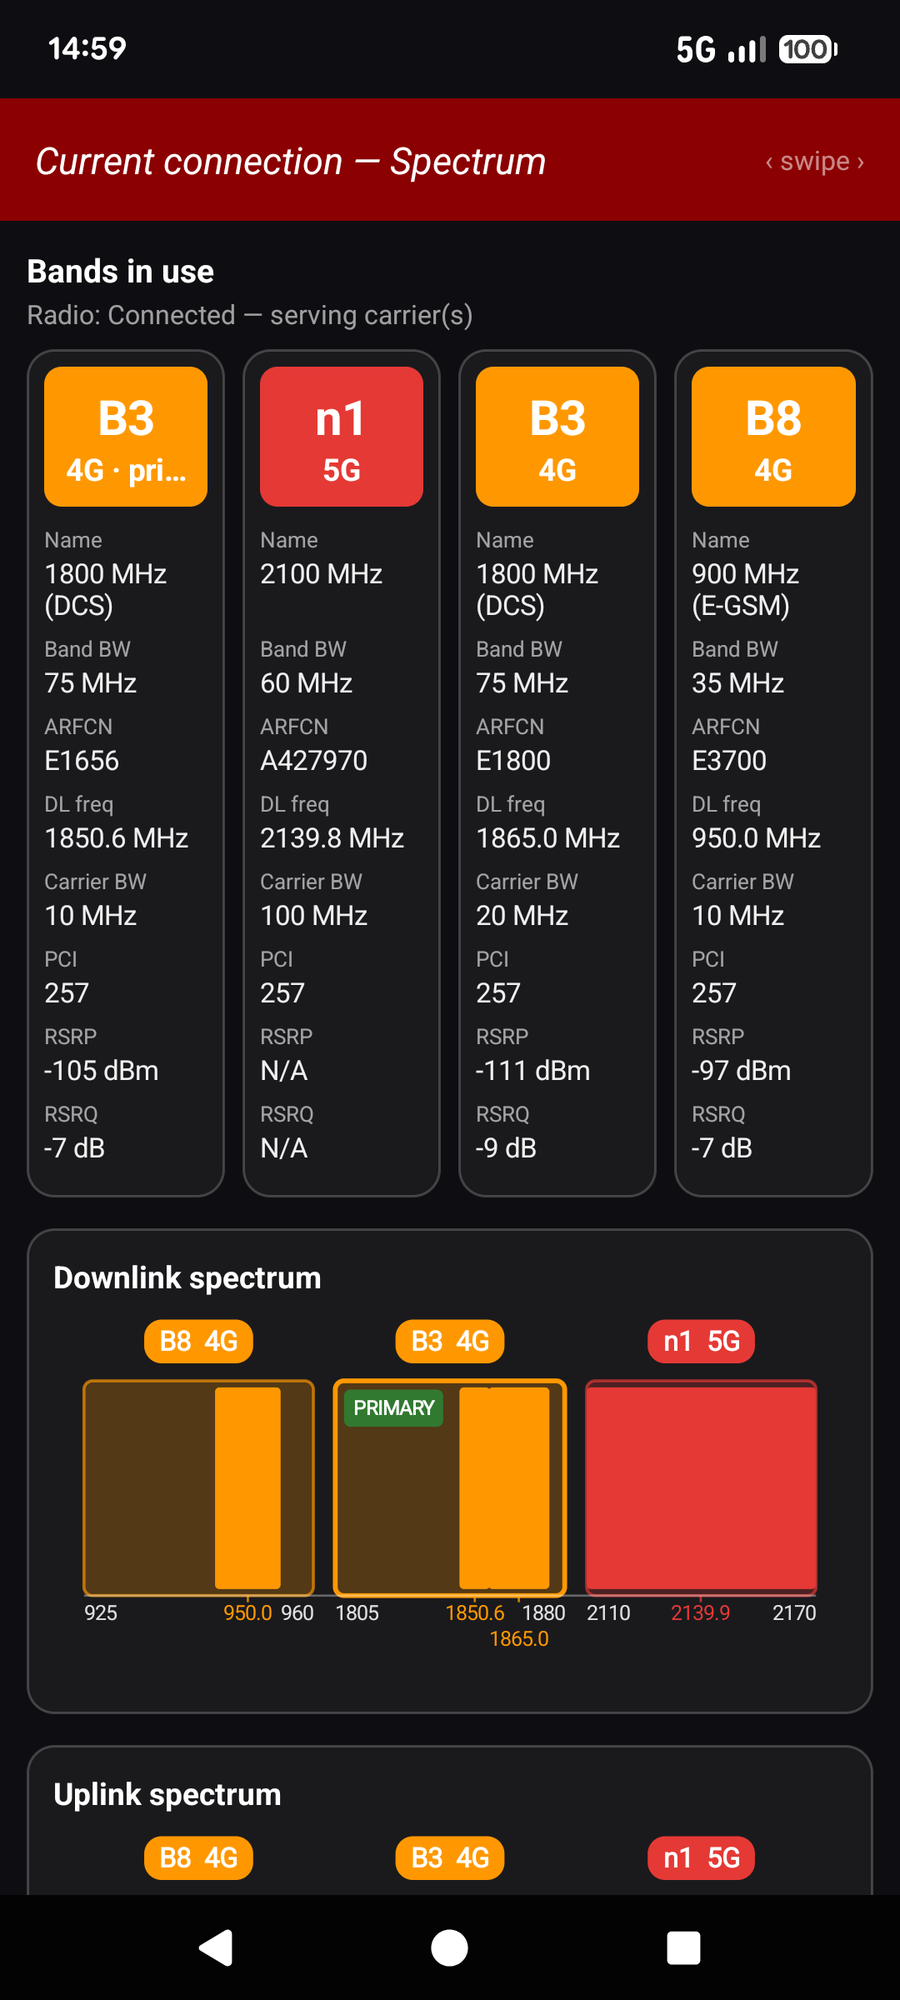
The same live connection, seen from the frequency side: every band and carrier placed on the real radio spectrum.
The same live connection, seen from the frequency side: every band and carrier placed on the real radio spectrum.
Across the top, up to four cards detail each band your connection is using. Each card is colour-coded by technology (2G, 3G, 4G and 5G each have their own colour), and the primary serving band is tagged. A small line above the cards notes the radio state, for example "Connected, serving carrier(s)".
These cards list even more per-carrier detail than the Geographical view. Every field is explained below.
Each card describes one carrier. Band and technology names follow the 3GPP standard, so the labels match those used across the industry.
The cards sit at the top of the screen, one per carrier. Below them, two full-width panels place those carriers onto the downlink and uplink spectrum. Keep the screenshot in view as you read the fields.
| Field | Meaning |
|---|---|
| Band label | The 3GPP band, coloured by generation: LTE bands are written B3, B8 …, 5G NR bands n1, n78 …, plus a "primary" mark on the serving band. |
| Name | The band's nominal centre frequency and its 3GPP band name, for example 1800 MHz (DCS), 900 MHz (E-GSM), 2100 MHz. |
| Band BW | The total width of the operator's licensed band (the whole allocation, not just your carrier). |
| ARFCN | The channel number that identifies the exact frequency: EARFCN on LTE, NR-ARFCN on 5G, UARFCN on 3G, ARFCN on 2G (shown here generically as (E)ARFCN). |
| DL freq | The downlink centre frequency in MHz that the channel number maps to. |
| Carrier BW | The bandwidth of the actual carrier you are using inside the band, for example 10, 20 or 100 MHz. |
| PCI | The physical-layer cell identity on the air interface: PCI on 4G/5G, PSC on 3G, BSIC on 2G. It distinguishes neighbouring cells on the same frequency. |
| RSRP | Reference-signal received power, i.e. the signal strength of this carrier (dBm). |
| RSRQ | Reference-signal received quality, i.e. the signal quality of this carrier (dB), which also reflects interference and load. |
Below the cards, two full-width panels place those same carriers onto the real radio spectrum: one for the downlink, one for the uplink.
Colour ties the two panels together: each band keeps its technology colour, so it is easy to trace a band from its card to its place on the downlink and uplink scales.
The Coverage Map and Route Logging tools record these same connection details as you move, and export them to Google Earth.
🌍 Explore the Coverage Map